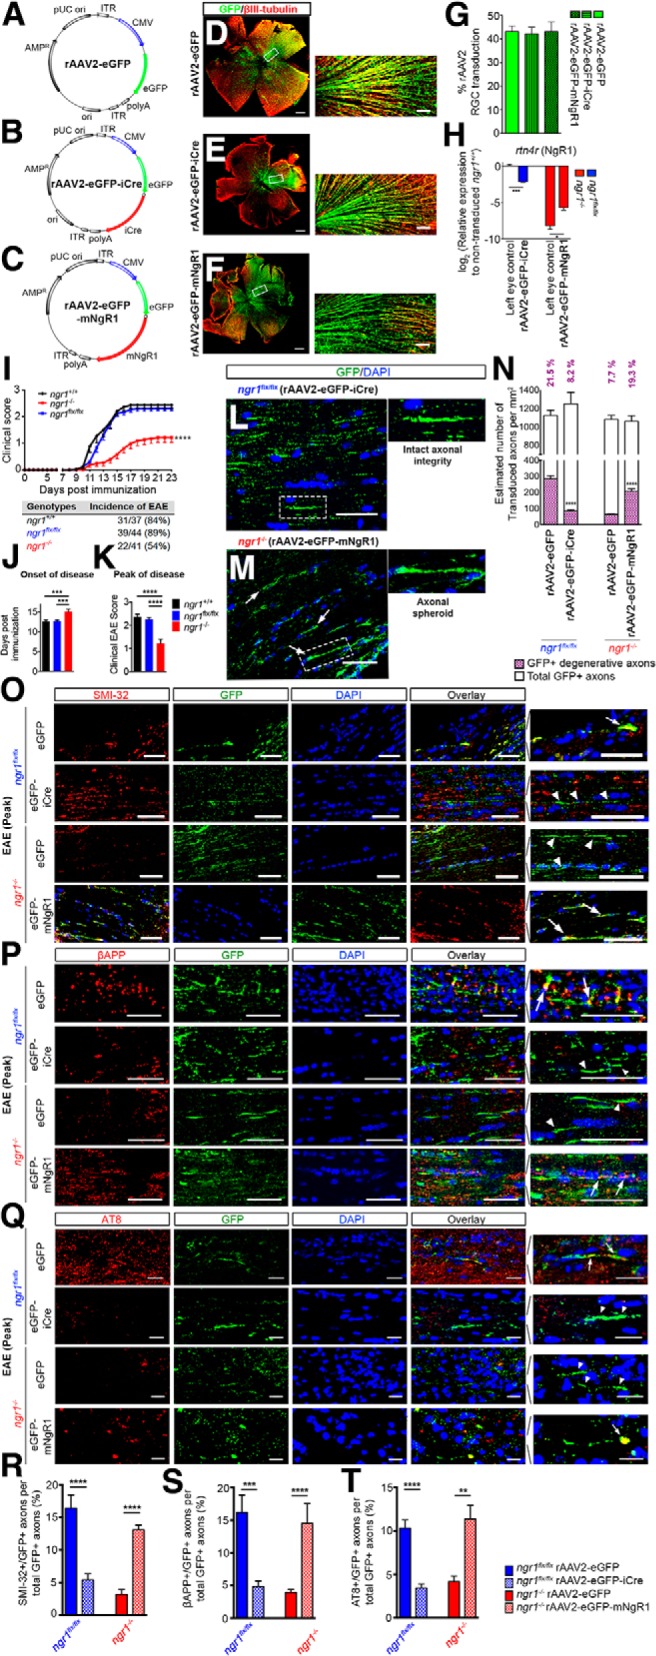
Figure 1.

Axon-specific ablation of ngr1 preserves axonal integrity during EAE whereas its re-expression potentiates axonal degeneration. A–C, rAAV2 vector maps that used in this study, (A) rAAV2-eGFP, (B) rAAV2-eGFP-iCre, and (C) rAAV2-eGFP-mNgR1. D–F, Representative retinal whole-mounts immunolabeled for eGFP and βIII-tubulin from (D) rAAV2-eGFP-, (E) rAAV2-eGFP-iCre-, and (F) rAAV2-eGFP-mNgR1-injected retinae. Scale bar, 500 μm. Magnified images showing colocalization of eGFP with βIII-tubulin are shown at the right-hand side. Scale bar, 50 μm. G, The percentage of rAAV2 transduction in RGCs (n = 22–29). H, qRT-PCR analysis of rAAV2-eGFP-iCre transduced retinae of ngr1flx/flx and rAAV2-eGFP-mNgR1 transduced retinae of ngr1−/− mice and their left retinae controls using rtn4r (encoding NgR1) probe (n = 3, mean ± SEM, one-way ANOVA with Tukey's post test; *p < 0.05, ***p < 0.001). I, Clinical progression of EAE upon immunization with CFA and MOG35–55 in female ngr1+/+ (n = 37), ngr1flx/flx (n = 44), and ngr1−/− (n = 41) mice (mean ± SEM, repeated-measures ANOVA; ****p < 0.0001). The incidence of EAE for each genotype is shown underneath the graph. J, Average onset of EAE, defined as the day of the first clinical score reached in each mouse. K, Average peak score of disease (mean ± SEM, one-way ANOVA with Tukey's post test; ***p < 0.001, ****p < 0.0001). L, M, Representative images immunolabeled for eGFP and DAPI from (L) rAAV2-eGFP-iCre-injected right optic nerve of ngr1flx/flx mice and (M) rAAV2-eGFP-mNgR1-injected right optic nerve of ngr1−/− mice at the peak stage of EAE. Magnified images of single eGFP+ transduced axons are shown underneath the larger scaled images. N, Estimated numbers of transduced axons and morphologically degenerative axons per square millimeter of right optic nerve sections in either rAAV2-eGFP- or rAAV2-eGFP-iCre-injected ngr1flx/flx and either rAAV2-eGFP- or rAAV2-eGFP-mNgR1-injected ngr1−/− mice at the peak stage of EAE. (n = 10, Student's t test; ****p < 0.0001). O–Q, Representative images from either rAAV2-eGFP- or rAAV2-eGFP-iCre-injected optic nerves of ngr1flx/flx mice and either rAAV2-eGFP- or rAAV2-eGFP-mNgR1-injected optic nerves of ngr1−/− mice coimmunolabeled for either (O) SMI-32, (P) βAPP, or (Q) AT8 and eGFP, followed by DAPI counterstaining. Scale bar, 50 μm. Magnified images of intact (in rAAV2-eGFP-iCre-injected ngr1flx/flx and rAAV2-eGFP-injected ngr1−/− mice optic nerves) or degenerative axons (in rAAV2-eGFP-injected ngr1flx/flx and rAAV2-eGFP-mNgR1-injected ngr1−/− optic nerves) are shown on the right (arrow indicates degenerative axons whereas arrowhead indicates intact axons). Scale bar, 10 μm. R–T, The percentage of colocalization of eGFP+ transduced axons with (R) SMI-32, (S) βAPP, and (T) AT8 (n = 10, mean ± SEM, Student's t test; **p < 0.01, ***p < 0.001, ****p < 0.0001). For axon-specific overexpression of NgR1 in optic nerves of naive ngr1−/− mice (Figure 1-1).
