

Abstract
The aim of this study was to develop nomograms to predict long-term overall survival and cancer-specific survival of patients with osteosarcoma.
We carried out univariate and multivariate analyses and set up nomograms predicting survival outcome using osteosarcoma patient data collected from the Surveillance, Epidemiology and End Results (SEER) program of the National Cancer Institute (2004–2011, n = 1426). The patients were divided into a training cohort (2004–2008, n = 863) and a validation cohort (2009–2011, n = 563), and the mean follow-up was 55 months.
In the training cohort, 304 patients (35.2%) died from osteosarcoma and 91 (10.5%) died from other causes. In the validation cohort, 155 patients (27.5%) died from osteosarcoma and (12.3%) died from other causes. Nomograms predicting overall survival (OS) and cancer-specific survival (CSS) were developed according to 6 clinicopathologic factors (age, tumor site, historic grade, surgery, AJCC T/N, and M), with concordance indexes (C-index) of 0.725 (OS) and 0.718 (CSS), respectively. The validation C-indexes were 0.775 and 0.742 for OS and CSS, respectively.
Our results suggest that we have successfully developed highly accurate nomograms for predicting 5-year OS and CSS for osteosarcoma patients. These nomograms will help surgeons customize treatment and monitoring strategies for osteosarcoma patients.
Keywords: database, nomogram, osteosarcoma, prediction, survival
1. Introduction
Osteosarcoma is the most common primary sarcoma of bone and affects patients of every age.[1] Due to clinicopathologic heterogeneity, 5-year overall survival (OS) of osteosarcoma patients varies from 28% to 70%.[2,3] Therefore, accurate estimates of osteosarcoma patient prognoses based on clinical characteristics would help clinicians provide appropriate individual treatment.
Because osteosarcoma is a rare tumor, with an estimated incidence of 1.7 to 4.4 per million per year depending on age,[1,4,5] obtaining a meaningful number of patients to study is challenging. We used the Surveillance, Epidemiology and End Results (SEER) program database, which is a common tool used for the analysis of rare cancers. The SEER program collects and publishes cancer incidence and survival data from 19 population-based cancer registries covering approximately 28% of the US population. To our knowledge, no such studies on osteosarcoma have been conducted using data from a national database.
Nomograms, which are useful scoring and visualization predictive tools, can estimate individual patient survival with higher accuracy than the widely used American Joint Committee on Cancer (AJCC) TNM staging system. Nomograms have been extensively applied for a variety of cancers,[6–12] and are based on a series of factors that are considered together. The purpose of the investigation was to develop osteosarcoma nomograms that predict long-term OS and cancer-specific survival (CSS) based on multiple clinical characteristics, for the first time with this large number of cases from the SEER database, to improve individual patient treatment and follow-up strategy.
2. Materials and methods
2.1. Patient data collection
Osteosarcoma patient data were collected from the SEER program of the National Cancer Institute. Ethical approval was waived because we got the registered account the approval of using patients’ data for research purposes, from SEER database. The study conforms to the provisions of the Declaration of Helsinki. Informed patient consent was not required for data released by the SEER database.
For data collected from the SEER program, the initial selection criteria were as follows: the osteosarcoma primary tumor site was bones and joints, malignant behavior, and diagnosed between 2004 and 2011. Final selection criteria were as follows: active follow-up; clinical and pathological information including age, race, sex, tumor site, tumor grade, and AJCC/TNM stage were complete and definite; morphology diagnosis was osteosarcoma that was confirmed microscopically. The patients were divided into a training cohort and validation cohort.
2.2. Data elements
For analyses, clinical characteristics were transformed into categorical variables on the basis of recognized cutoff values. Patients were categorized into 3 distinct age groups (0–24 years; 25–59 years; ≥60 years), as has been previous reported.[1,13] Race classifications included white, black, and others. Primary tumor sites included axial skeleton and extremities. Histologic subtypes included osteosarcoma, not otherwise specified (NOS), and others (chondroblastic osteosarcoma, fibroblastic osteosarcoma, telangiectatic osteosarcoma, osteosarcoma in Paget disease, small cell osteosarcoma, central osteosarcoma, intraosseous well-differentiated osteosarcoma, parosteal osteosarcoma, periosteal osteosarcoma, and high grade surface osteosarcoma). Grade was categorized into 4 groups (well differentiated, moderately differentiated, poorly differentiated, and undifferentiated). Laterality included left, right, not a paired site (axial), and bilateral. All patient TNM classifications were staged according to the 6th edition AJCC Staging Manual.[14] The SEER historic stage included localized, regional, distant, and unstaged. Tumor-directed surgery included surgery performed and surgery not performed due to all reasons. Marital status included married and others (divorced, separated, single, unknown, and widowed). We compiled socioeconomic statue (SES) data for all patients with osteosarcoma and categorized the resulting income, poverty, and education data for the country of residence into quartiles, as has been done in previous investigations.[1,13] We then assigned each quartile a number from 1 to 4, with a higher number reflecting higher income, less poverty, or more education. For median family income, the quartiles were <$46,450, $46,450 to $51,400, $51,400 to $63,550, and >$63,550. For the percentage of individuals below the poverty line, the quartiles were >17.90%, 12.44% to 17.90%, 8.41% to 12.43%, and <8.41%. For the percentage of individuals at least 25 years old with <12 years of education, the quartiles were >28.77%, 18.82% to 28.77%, 15.16% to 18.81%, and <15.16%.
2.3. Nomograms
The training cohort was used to establish the OS and CSS nomograms. The OS was defined as the time from diagnosis to death or censoring (if a patient was alive at the last follow-up). The Kaplan–Meier method and log-rank test were used to conduct the univariate prognostic analysis. Variables that were possible prognostic factors (P < .05) on univariate analyses were included in the multivariate Cox proportional hazards analysis to reveal independent OS factors (P < .05). Then, the independent factors in the multivariate analysis were used to build nomograms for 3-year and 5-year OS for patients with osteosarcoma by employing a stepwise-selection method in the R software. The CSS was defined as the time from diagnosis to death attributed to osteosarcoma or censoring (if a patient was alive at the last follow-up or death from other causes). The cumulative incidence function (CIF) was used to assess the probability of death. Variables whose P values were <.05 for the CIF values were considered significant independent CSS factors. Similarly, we developed nomograms with those significant independent factors, to predict 3-year and 5-year CSS in patients with osteosarcoma.
2.4. Nomograms validations
The validation cohort was employed to estimate the predicative accuracy of the model by performing internal validation; by C-index, performed using bootstrapping with 1000 resamples, and by calibration plots using 10-fold cross validation. The C-indexes quantified the discrimination between predicted and actual situations, with values ranging from 0.5 to 1.0, representing no discrimination to prefect discrimination. In addition, a marginal estimate versus model was used to plot a calibration curve that presented the correlation between nomogram-predicted and actual survival. The C-indexes (both OS and CSS) of our nomogram were compared with those of the classical model of survival prediction, the AJCC staging system, and a significant difference was defined by P < .001.
2.5. Statistical management
All statistical analysis was conducted using the SPSS software version 22.0 (SPSS Inc., Chicago, IL) and the R software version 3.4.0 (R Foundation for Statistical Computing, Vienna, Austria; www.R-project.org) with the R packages rms and cmprsk.
3. Results
3.1. Clinical characteristics of patients
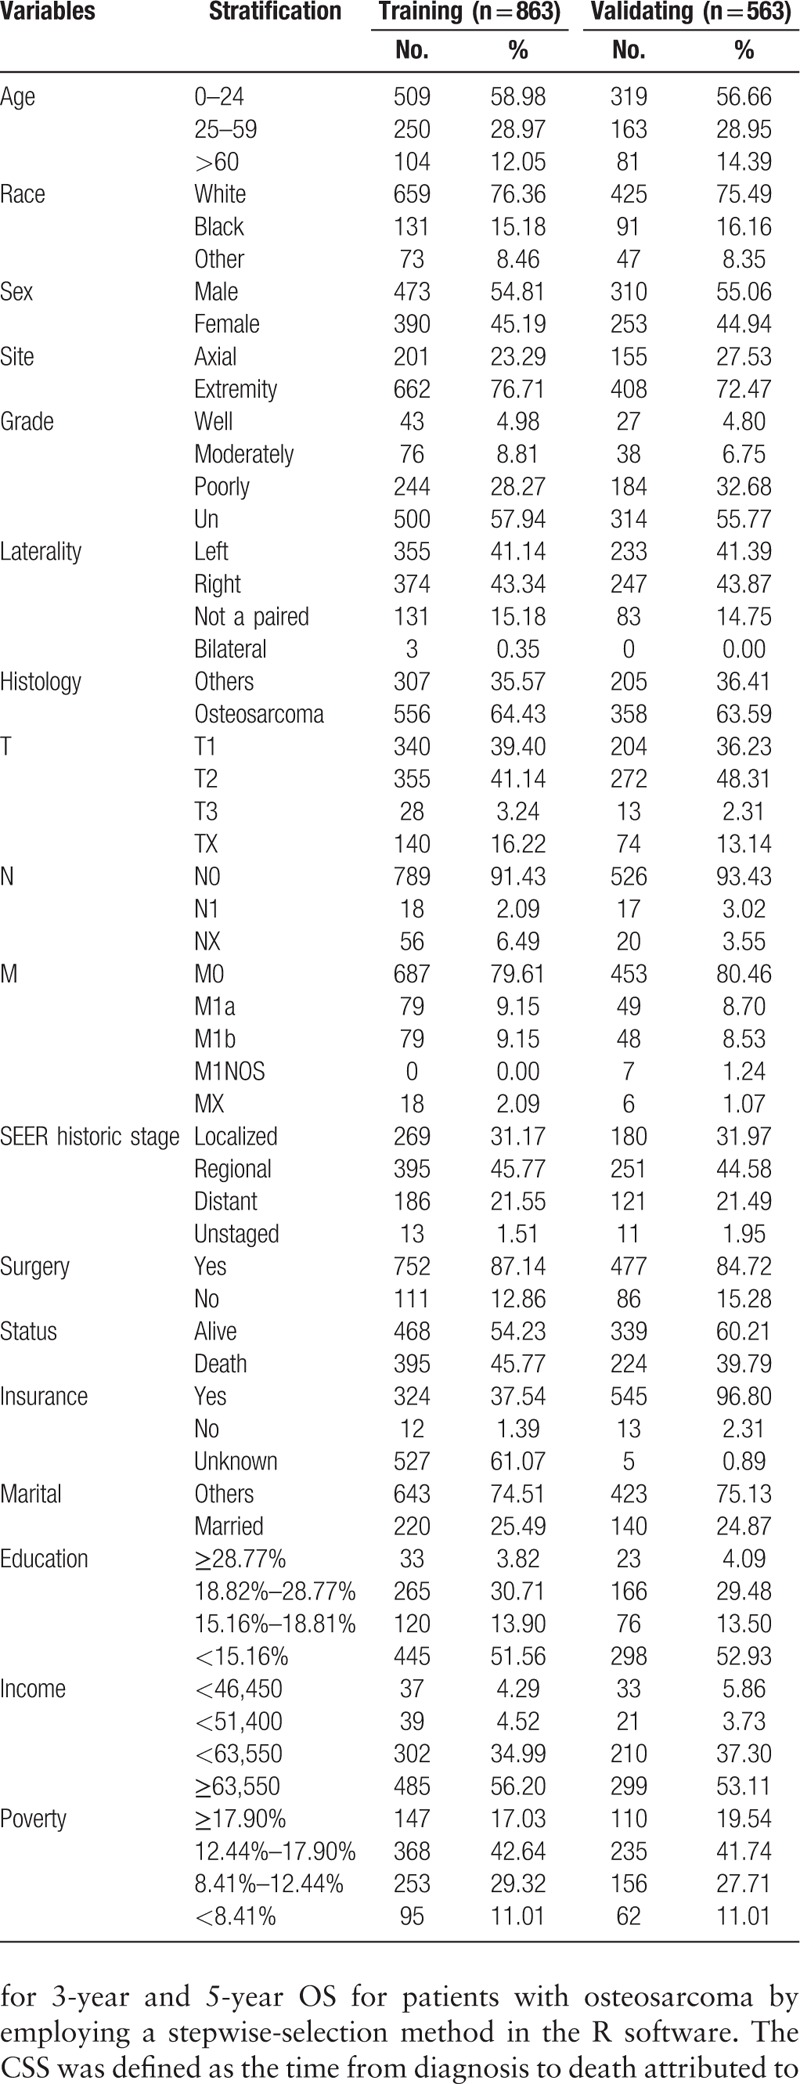
After applying the collecting criteria, a total of 1426 primary osteosarcoma patients from the SEER database of the National Cancer Institute, diagnosed between 2004 and 2011, were included in this study. The patients were divided into a training cohort (2004–2008, n = 863) and a validation cohort (2009–2011, n = 563). The mean follow-up period was 54.8 ± 37.5 months. Clinical characteristics and outcomes are listed in Table 1.
Table 1.
Clinical characteristics and outcomes of the training and validating cohorts.
3.2. Nomograms construction
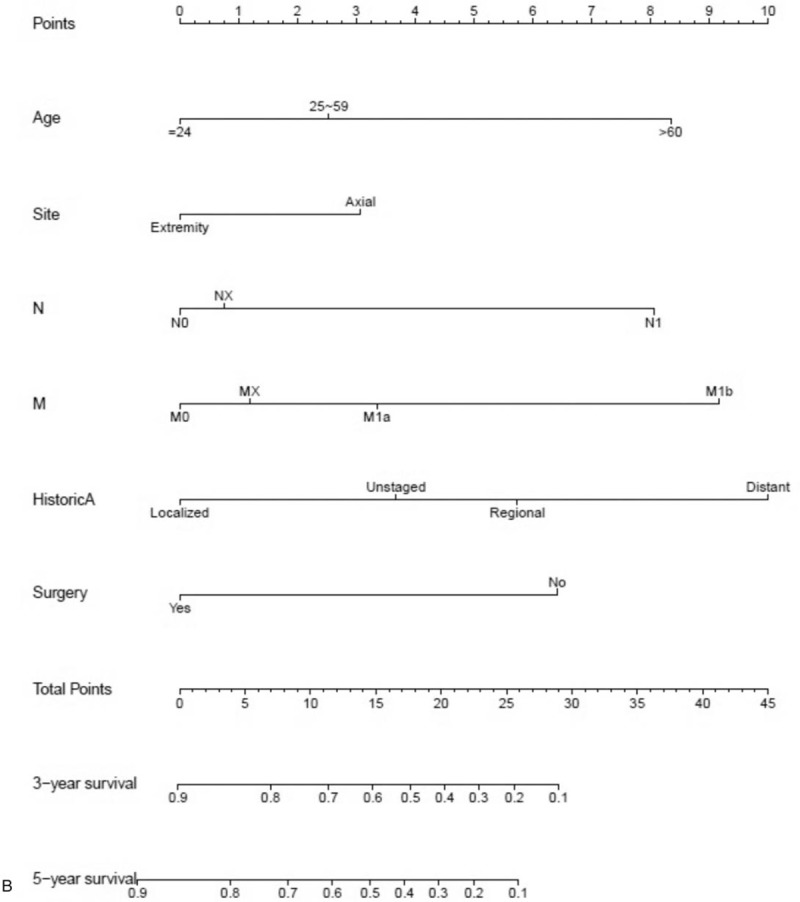
After univariate analyses, age, tumor site, laterality, histologic subtypes, T (AJCC, tumor size), N (AJCC, lymph nodes), M (AJCC, metastasis), SEER historic stage, surgery performed, and marital status were found to be statistically associated with OS (P < .05), whereas sex, race, grade, income, poverty, education, and insurance status were not (Table 2). Multivariate analyses revealed that 6 variables were independent prognostic factors for OS in patients with osteosarcoma (P < .05); age, tumor site, T, M, SEER historic stage, and surgery performed (Table 3). These variables were used to develop the nomogram for predicting 3-year and 5-year OS (Fig. 1 A). Similarly, after univariate and multivariate analyses (Tables 4 and 5), 6 variables were independent prognostic factors for CSS in patients with osteosarcom: age, tumor site, N, M, SEER historic stage, and surgery performed. From this data another nomogram was created using these variables for predicting 3-year and 5-year CSS (Fig. 1 B). The survival curves for OS and CSS are shown in Figures 2 and 3.
Table 2.
Univariate analysis of OS in the nomogram cohort.
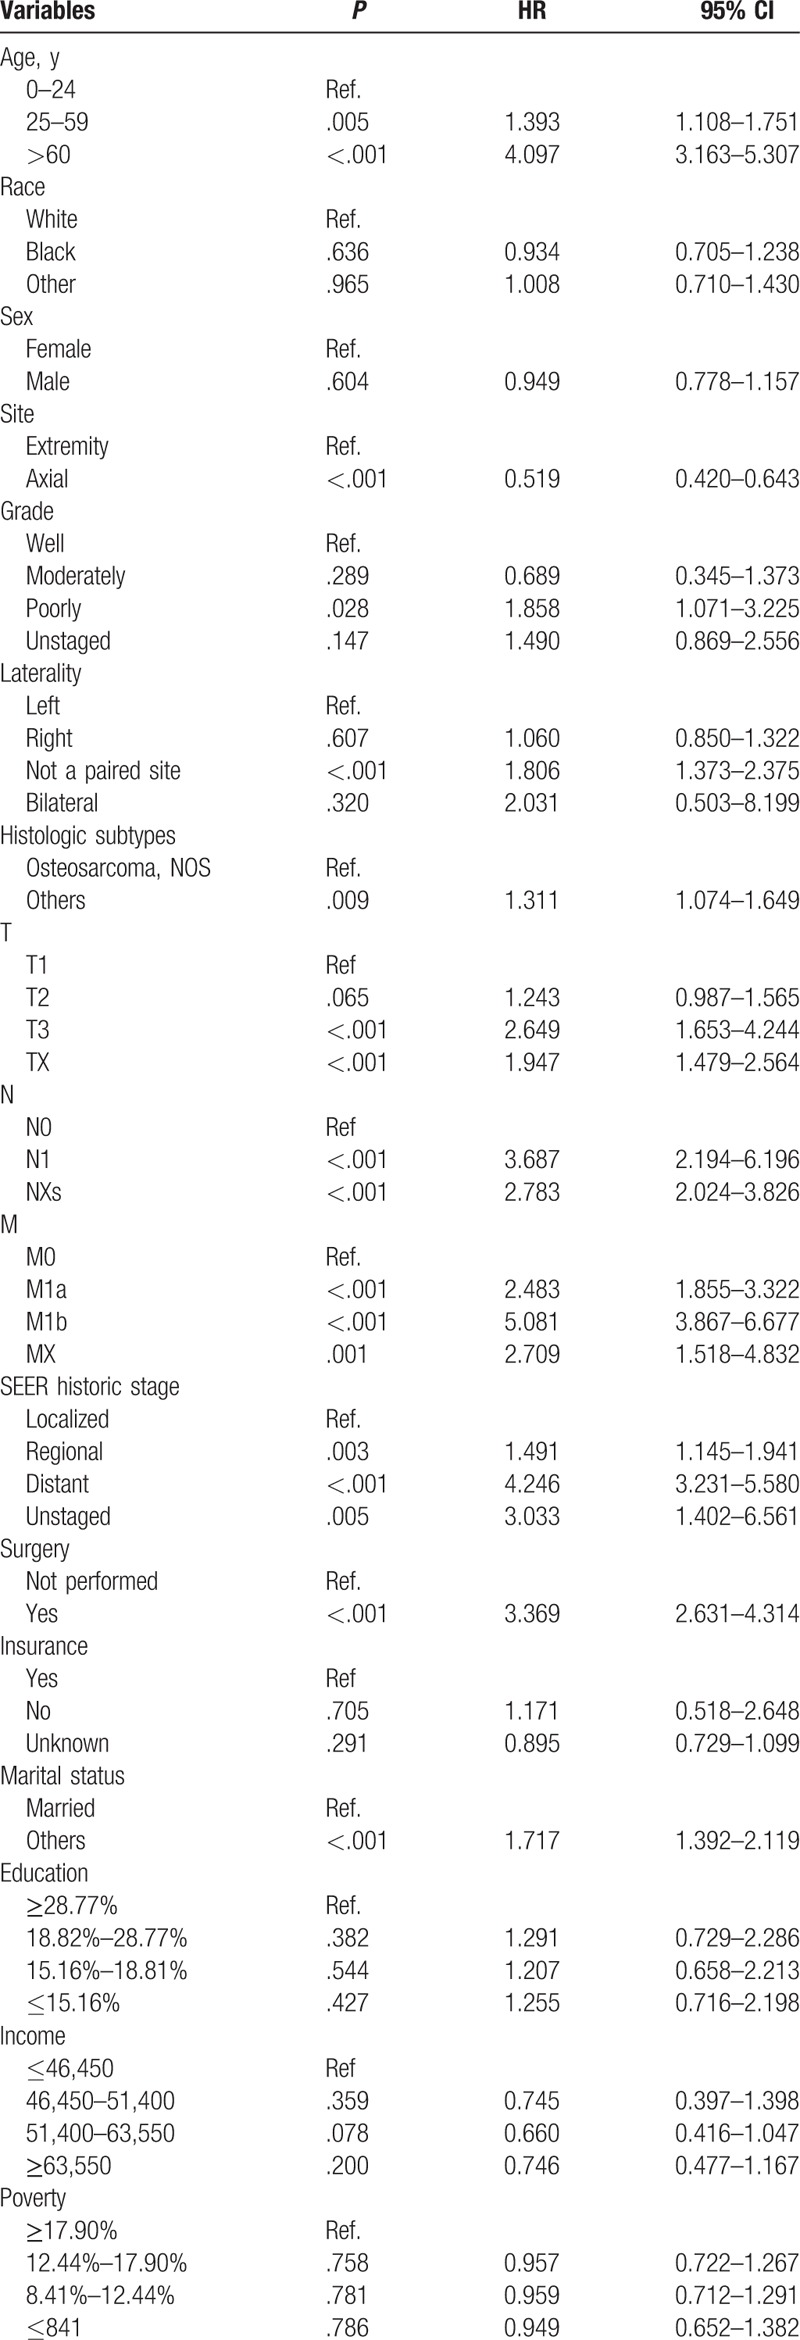
Table 3.
Multivariate analysis of OS in the nomogram cohort.
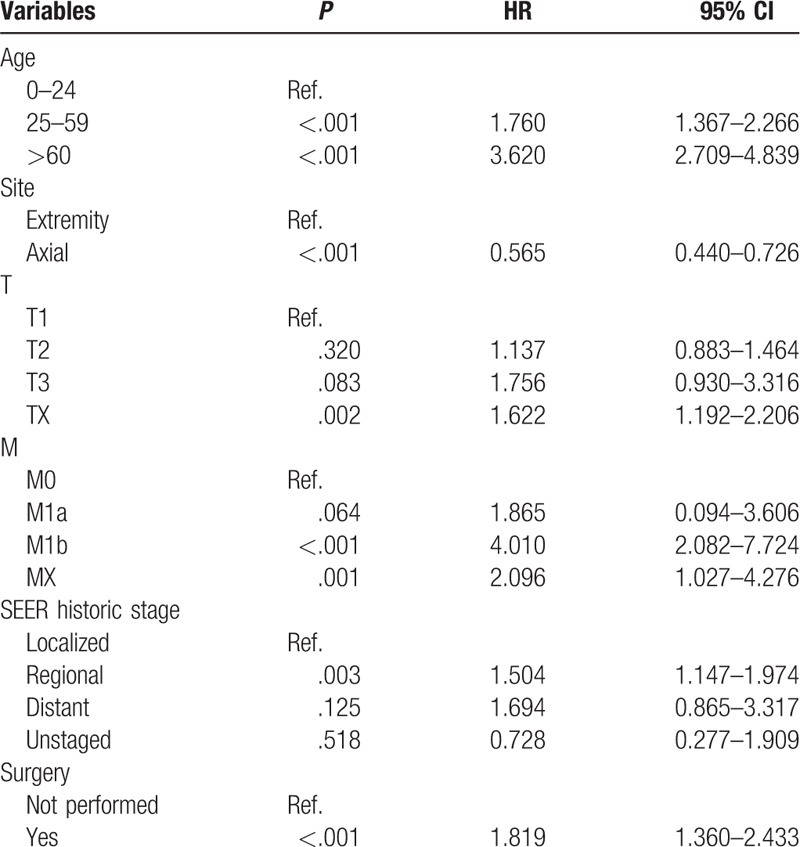
Figure 1.
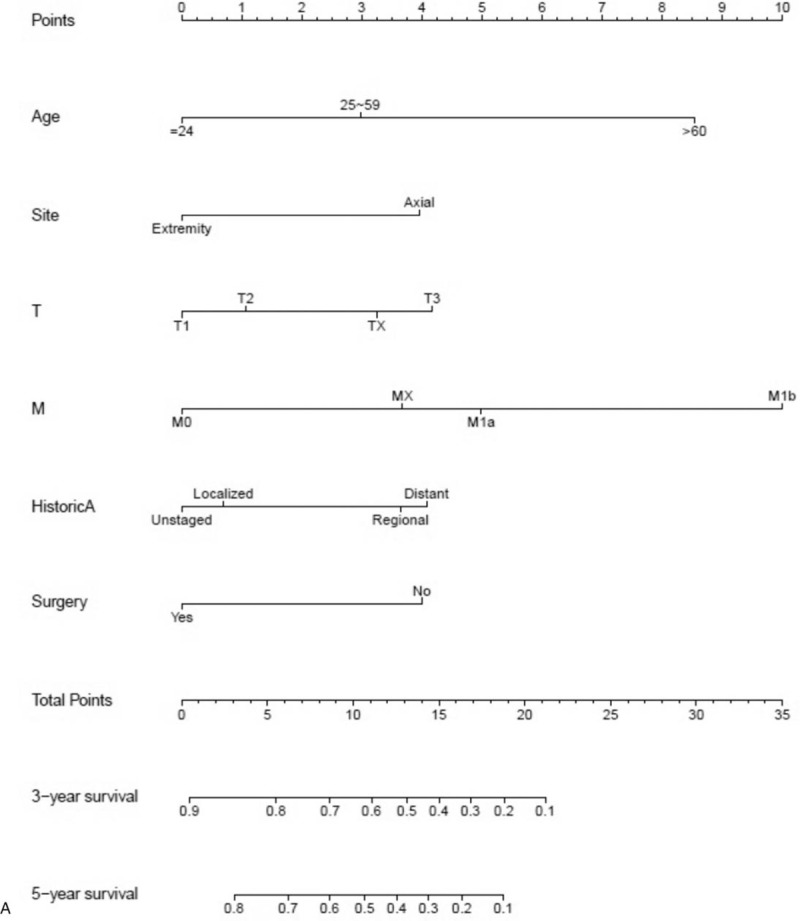
Nomograms predicting 3- and 5-year OS (A) and CSS (B).
Table 4.
Univariate analysis of CSS in the nomogram cohort.
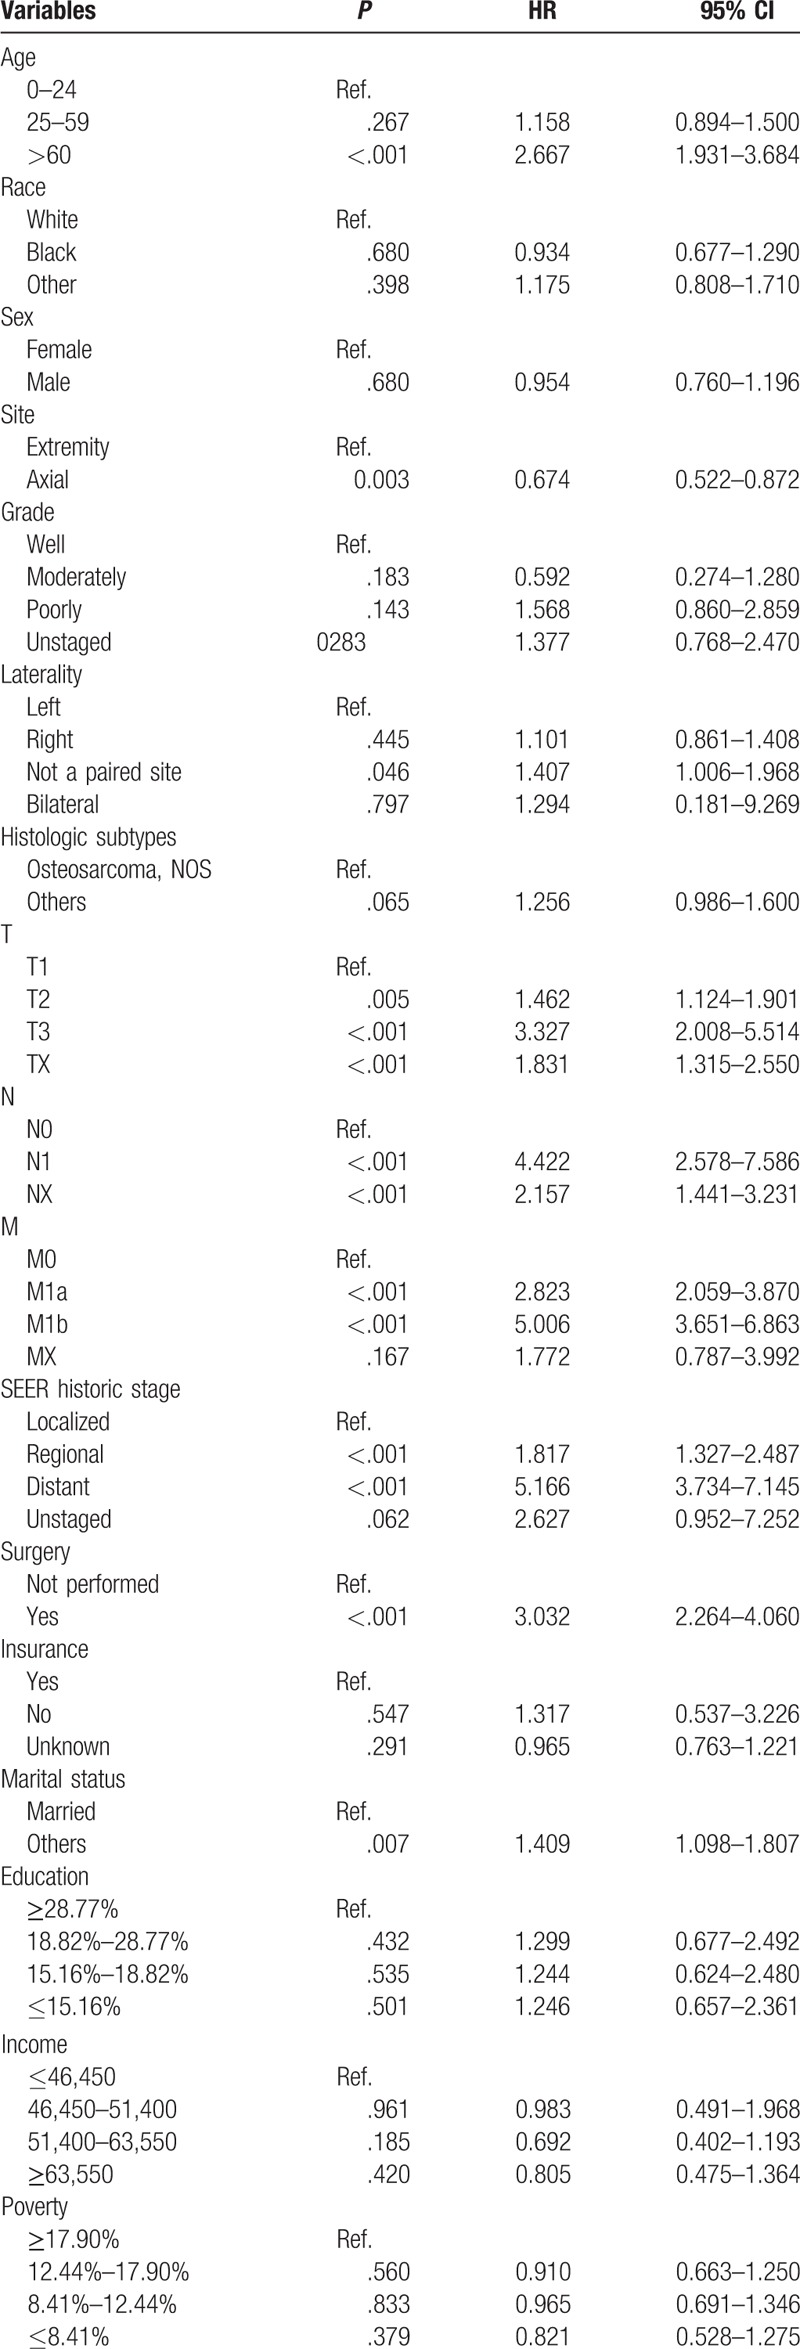
Table 5.
Multivariate analysis of CSS in the nomogram cohort.
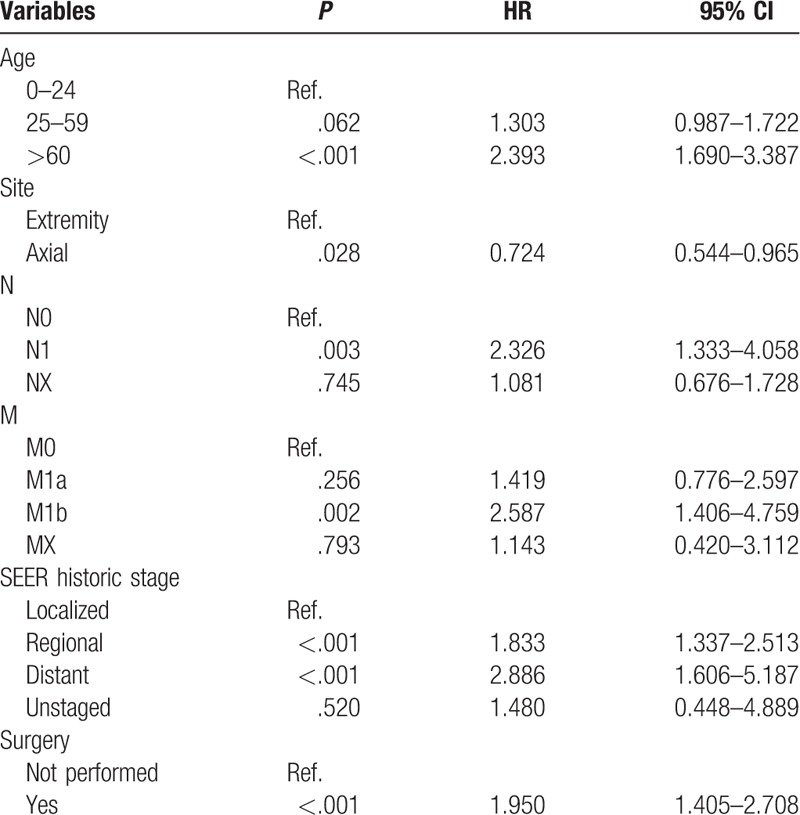
Figure 1 (Continued).
Nomograms predicting 3- and 5-year OS (A) and CSS (B).
Figure 2.
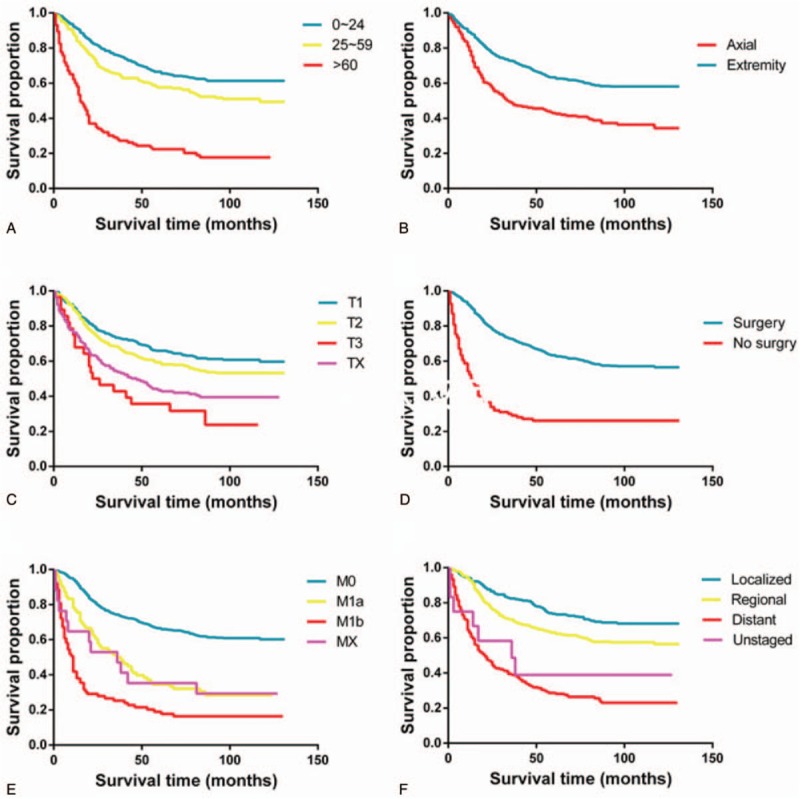
Kaplan–Meier curves for significant factors derived from multivariate analyses in OS: (A) age, (B) primary tumor site (axial or extremity), (C) T stage, (D) surgery, (E) M stage, and (F) the SEER historic stage (tumor invasion).
3.3. Nomograms validation
In the training cohort, 304 patients (35.2%) died from osteosarcoma and 91 (10.5%) died from other causes. In the validation cohort, 155 patients (27.5%) died from osteosarcoma and (12.3%) died from other causes. The C-indexes for OS and CSS in the training cohort were 0.725 (95% confidence interval [CI], 0.700–0.750) and 0.718 (95% CI, 0.688–0.748), respectively. We performed internal validation of the nomograms with the validation cohort from the SEER database. Models showed good accuracy with a C-index of 0.775 (95% CI, 0.744–0.806) and 0.742 (95% CI, 0.712–0.772) for OS and CSS, respectively. The calibration curves approached the 45-degree ideal match straight line, indicating that the nomograms for OS and CSS in osteosarcoma were generally well calibrated (Fig. 4).
Figure 3.
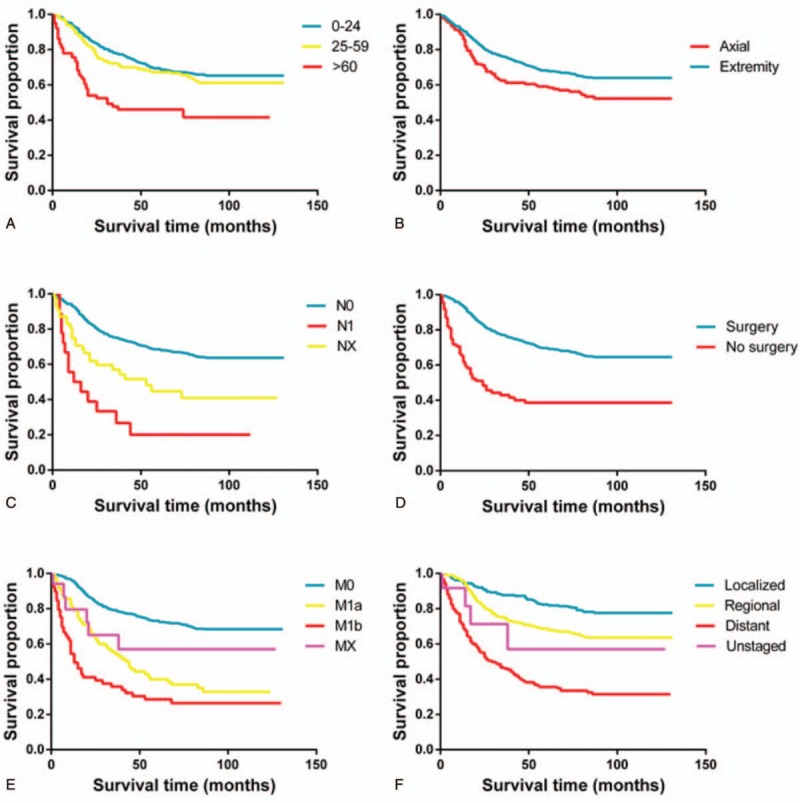
Kaplan–Meier curves for significant factors derived from multivariate analyses in CSS: (A) age, (B) primary tumor site (axial or extremity), (C) T stage, (D) surgery, (E) M stage, and (F) the SEER historic stage (tumor invasion).
Figure 4.
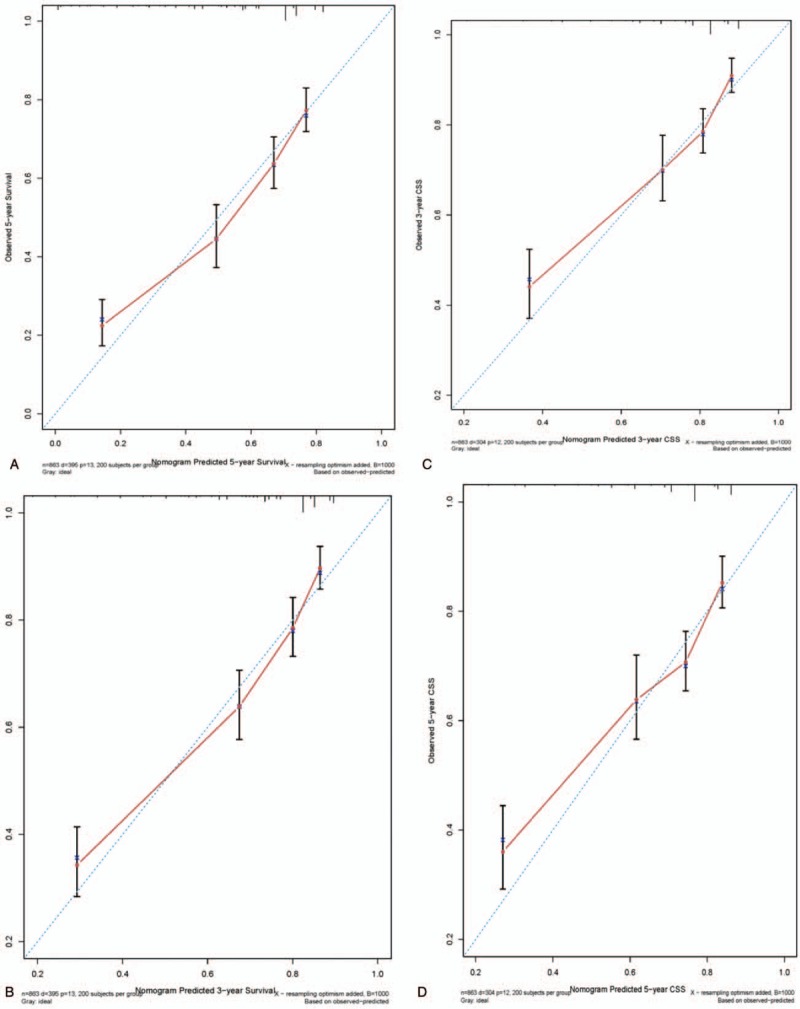
Calibration curves for nomograms predicting 3- and 5-year OS and CSS: (A) 3-year OS, (B) 5-year OS, (C) 3-year CSS, and (D) 5-year CSS.
3.4. Nomograms compared with AJCC
The C-indexes (0.725 for OS and 0.718 for CSS) of our nomogram were compared with those of the classical model of survival prediction, the AJCC staging system, whose C-indexes were 0.663 (95% CI, 0.636–0.690) and 0.664 (95% CI, 0.633–0.695) for OS and CSS, respectively. There was a significant difference between the 2 models (P < .001). Our nomograms have better power for predicting the prognosis of patients with osteosarcoma.
4. Discussion
Osteosarcoma is a highly malignant bone tumor with a low incidence. Due to all kinds of clinical factors, such as histological diversity, metastasis, tumor size, location, and invasion, the 5-year overall survival rate of osteosarcoma patients varies widely, ranging from 28% to 70%.[2,3] Therefore, there are still some challenges when making treatment-related decisions and establishing follow-up strategies. A nomogram is a powerful statistical tool that can help in the decision making process. To our limited knowledge, there is no well-design nomogram for osteosarcoma based on a nation-wide population. Using the data selected from the SEER database with a mean follow-up of 55 months, we developed nomograms for predicting 3- and 5-year OS and CSS in patients with osteosarcoma.
For the predictive accuracy of nomograms, we used the Kaplan–Meier method and the Cox's proportional hazards regression model to select factors to develop the OS nomogram. A competing risk model was used to select factors for the development of the CSS nomogram. In addition, C-indexes and calibration plots were applied to estimate the predictive accuracy of the models by performing internal validation. All nomogram C-indexes were >0.7 and there was excellent agreement between calibration curves and 45-degree perfect match straight lines.
It is simple and easy to use a nomogram to predict the survival possibility of an osteosarcoma patient. First, a vertical line should be drawn from every factor to the “Point” bar in the nomogram. Thereby, the total points value is obtained. Another vertical line should be drawn from the “Total Points” bar to the survival possibility bar to obtain the corresponding survival. For example, consider a 55 years old male white patient with a T3N0M0 moderate-differentiated localized osteosarcoma (NOS) at the right lower limb, who underwent a surgery. By applying our nomograms, his 5-year OS and CSS predicted is 62% and 86%, respectively.
In this nomogram, increasing patient age is associated with a worse prognosis in patients with osteosarcoma, consistent with previous studies.[15,16] Older patients may be more likely to present with metastatic disease and worse general health conditions than younger patients. The present study also indentified axial tumor location, high SEER historic stage, and large tumor size as independent risk factors for decreased OS and CSS. Axial tumor location, high SEER historic stage, and large tumor size suggest significant challenges for surgeons attempting to obtain adequate margins during surgical resection. In addition, tumors in the axial skeleton are in closer proximity to large vessels, nerves, and important organs, which may increase the likelihood of metastasis.[1] Furthermore, tumors in the axial skeleton tend to grow undetected, whereas tumors in the extremities tend to shown some clinical signs, such as palpable mass and increasing pain, which are evaluated without delay. These reasons partially explain the inferior post surgical results in patients with tumors in the axial skeleton. Finally, it has been demonstrated that metastasis and surgery not performed usually indicate a poor prognosis.[17–19]
Although our nomograms estimate the prognosis of the patients who suffered from osteosarcoma with a high accuracy, according to C-indexes and calibration plots, our study had certain limitations. First, osteosarcoma TNM stage information was not available from the SEER program until 2004. The earliest record included in our study was diagnosed in that year, and we were not able to predict a survival time >5 years. Second, there are likely important independent prognosis factors that have not yet been identified by researchers or recorded by the SEER program, such as chemotherapy [20–22] and perineural/perivascular invasion. These factors might be associated with the prognosis of osteosarcoma but were not included in our study.
In conclusion, based on a large population based cohort provided by the SEER program, we have developed clinically useful nomograms which can predict 3- and 5-year OS and CSS for patients with osteosarcoma, for the first time with this large number of cases from the SEER database. The performance of these nomograms was accurate and they could help clinicians in making decisions about surgical, adjuvant therapeutic and follow-up strategies to treat osteosarcoma patients more effectively.
Author contributions
Study conception and design: WC, YL. Data acquisition and quality control of data: WC, YL. Data analysis and interpretation: WC. Statistical analyses of the data: WC. Manuscript preparation and editing: WC. Final review and approval of manuscript: All authors.
Conceptualization: Wenhao Chen, Yuxiang Lin.
Data curation: Wenhao Chen.
Investigation: Wenhao Chen.
Methodology: Eenhao Chen.
Software: Wenhao Chen.
Supervision: Wenhao Chen.
Validation: Wenhao Chen.
Writing—original draft: Wenhao Chen.
Writing—review and editing: Yuxiang Lin.
Footnotes
Abbreviations: AJCC = American Joint Committee on Cancer, CIF = cumulative incidence function, CSS = cancer-specific survival, NOS = not otherwise specified, OS = overall survival, SEER = Surveillance, Epidemiology and End Results, SES = socioeconomic statue.
Availability of data and materials: Osteosarcoma patient data in this study were collected from the SEER program of the National Cancer Institute. Final selection criteria were described in the patient data collection paragraph of the section Materials and Methods. All data are accessible from the SEER database or the authors.
The authors have no funding and conflicts of interest to disclose.
References
- [1].Miller BJ, Cram P, Lynch CF, et al. Risk factors for metastasis disease at presentation with osteosarcoma. J Bone Joint Surg Am 2013;95e89:1–8. [DOI] [PMC free article] [PubMed] [Google Scholar]
- [2].Wang SD, Ren TT, Huang Y, et al. BMPR2 and HIF1-( overexpression in resected osteosarcoma correlates with distant metastasis and patient survival. Chin J Can Res 2017;29:447–54. [DOI] [PMC free article] [PubMed] [Google Scholar]
- [3].Li YJ, Yao K, Lu MX, et al. Prognostic value of the C-reactive protein to albumin ratio: a novel inflammation-based prognostic indicator in osteosarcoma. Onco Targets Ther 2017;10:5255–61. [DOI] [PMC free article] [PubMed] [Google Scholar]
- [4].Yang J, Zhang W. New molecular insights into osteosarcoma targeted therapy. Curr Opin Oncol 2013;25:398–406. [DOI] [PubMed] [Google Scholar]
- [5].He JP, Hao Y, Wang XL, et al. Review of the molecular pathogenesis of osteosarcoma. Asian Pac J Can Prev 2014;15:5967–76. [DOI] [PubMed] [Google Scholar]
- [6].Hyder O, Marques H, Pulitano C, et al. A nomogram to predict long-term survival after resection for intrahepatic cholangiocarcinoma. JAMA Surg 2014;149:432–8. [DOI] [PubMed] [Google Scholar]
- [7].Yeh CN, Wang SY, Chen YY, et al. A prognostic nomogram for overall survival of patients after hepatectomy for intrahepatic cholangiocarcinoma. Anticancer Res 2016;36:4249–58. [PubMed] [Google Scholar]
- [8].Li Y, Ju J, Liu XX, et al. Nomograms for predicting long-term overall survival and cancer-specific survival in patients with major salivary gland cancer: a population-based study. Oncotarget 2017;8:24469–82. [DOI] [PMC free article] [PubMed] [Google Scholar]
- [9].Ju J, Wang J, Ma C, et al. Nomograms predicting long-term overall survival and cancer-specific survival in head and neck squamous cell carcinoma patients. Oncotarget 2017;7:51059–68. [DOI] [PMC free article] [PubMed] [Google Scholar]
- [10].Liu J, Geng Q, Liu Z, et al. Development and external validation of a prognostic nomogram for gastric cancer using the national cancer registry. Oncotarget 2016;7:35853–64. [DOI] [PMC free article] [PubMed] [Google Scholar]
- [11].Ganly I, Amit M, Kou L, et al. Nomograms for predicting survival and recurrence in patients with adenoid cystic carcinoma: An international collaborative study. Euro J Can 2015;51:2768–76. [DOI] [PMC free article] [PubMed] [Google Scholar]
- [12].Wen J, Ye F, He X, et al. Development and validation of a prognostic nomogram based on the log odds of positive lymph nodes (LODDS) for breast cancer. Oncotarget 2016;7:21046–53. [DOI] [PMC free article] [PubMed] [Google Scholar]
- [13].Duchman KR, Gao Y, Miller BJ. Prognostic factors for survival in patients with high-grade osteosarcoma using the surveillance, epidemiology, and end results (SEER) program database. Cancer Epidemiol 2015;39:593–9. [DOI] [PubMed] [Google Scholar]
- [14].Greene FL, Page DL, Fleming ID, et al. AJCC Cancer Staging Manual 6th edition. Ann Oncol 2003;14: 345-a-346(2). [Google Scholar]
- [15].Jawad MU, Cheung MC, Clarke J, et al. Osteosarcoma: improvement in survival limited to high-grade patients only. J Cancer Res Clin Oncol 2011;137:597–607. [DOI] [PMC free article] [PubMed] [Google Scholar]
- [16].Harting MT, Lally KP, Andrassy RJ, et al. Age as a prognostic factor for patients with osteosarcoma: an analysis of 438 patients. J Cancer Res Clin Oncol 2010;136:561–70. [DOI] [PMC free article] [PubMed] [Google Scholar]
- [17].Brennecke P, Arlt MJ, Campanile C, et al. CXCR4 antibody treatment suppresses metastatic spread to the lung of intratibial human osteosarcoma xenografts in mice. Clin Exp Metastasis 2014;31:339–49. [DOI] [PMC free article] [PubMed] [Google Scholar]
- [18].Bacci G, Rocca M, Salone M, et al. High grade osteosarcoma of the extremities with lung metastases at presentation: treatment with neoadjuvant chemotherapy and simultaneous resection of primary and metastatic lesions. J Surg Oncol 2008;98:415–20. [DOI] [PubMed] [Google Scholar]
- [19].Yang C, Wang G, Yang J, et al. Long noncoding RNA NBAT1 negatively modulates growth and metastasis of osteosarcoma cells through suppression of miR-21. Am J Cancer Res 2017;7:2009–19. [PMC free article] [PubMed] [Google Scholar]
- [20].He JP, Hao Y, Wang XL, et al. Review of the molecular pathogenesis of osteosarcoma. Asian Pac J Cancer Prev 2014;15:5967–76. [DOI] [PubMed] [Google Scholar]
- [21].Denduluri SK, Wang Z, Yan Z, et al. Molecular pathogenesis and therapeutic strategies of human osteosarcoma. J Biomed Res 2015;30:30. [DOI] [PubMed] [Google Scholar]
- [22].He H, Ni J, Huang J. Molecular mechanisms of chemoresistance in osteosarcoma (Review). Oncol Lett 2014;7:1352–62. [DOI] [PMC free article] [PubMed] [Google Scholar]