Figure 3.
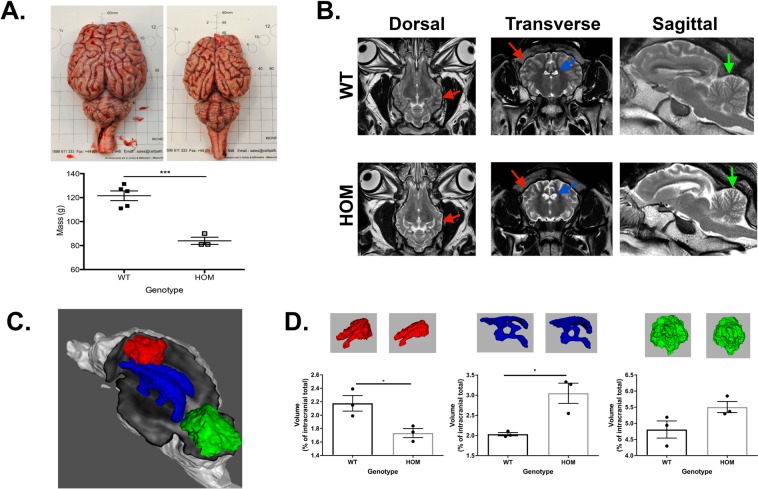
Selective pattern of neurodegeneration is observed in ovine model of INCL. (A) Gross anatomical disparity identified between WT control (left) and PPT1 homozygote (right) brains. Total fresh brain weight is significantly reduced in homozygote sheep shown in scatter plot (P = 0.0006). (B) Comparison of orthogonal T2-weighted spin echo imaging slices in example wild type (top row) and homozygous (bottom row) animals. There is global reduction in cerebral volume (red arrows), with ventriculomegaly (blue arrows) and thinning of the frontal cortex in the homozygote sheep. Note increased fluid signal between cerebellar folia (green arrows) suggestive of neocerebellar atrophy. (C) Volumetric renderings showing regions of interest for bilateral motor cortex (red), cerebellum (green), and tri-ventricular cerebrospinal fluid (blue). (D) Scatter plot with bar chart of volumetric data for the bilateral motor cortex, triventricular CSF and cerebellum with corresponding 3D images above each data point relating to the area and genotype. Statistical analyses utilized unpaired two-tailed Student’s t-test. Error bars represent SEM.

