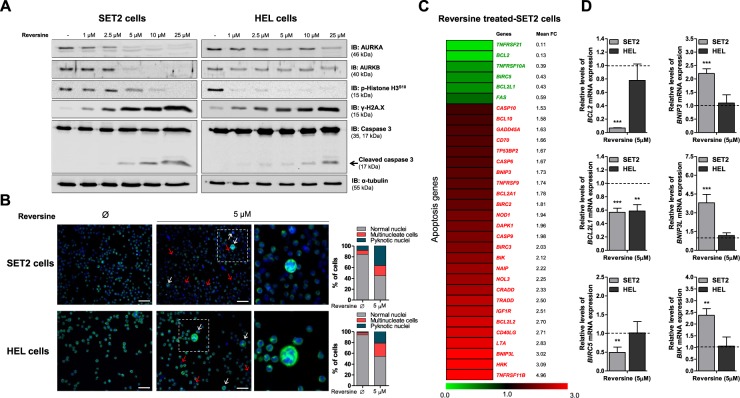
Figure 4.
Reversine induces DNA damage and apoptosis markers in JAK2V617F-positive cell lines. (A) Western blot analysis for AURKA, AURKB, phospho(p)-histone H3S10, p-histone H2A.XS139 (γ-H2A.X) and Caspase 3 (total and cleaved) in total cell extracts from SET2 and HEL cells treated with graded concentrations of reversine (vehicle, 1, 2.5, 5, 10 or 25 μM) for 48 hours; membranes were reprobed with the antibody for the detection of the respective total protein or α-tubulin, and developed with the SuperSignal™ West Dura Extended Duration Substrate system using a Gel Doc XR+ imaging system. Cropped blots are shown and full-length blots are included in Supplementary Fig. 7. (B) Immunofluorescence analysis of SET2 and HEL cells treated or not with 5 μM reversine for 24 hours, displaying α-tubulin (green) and DAPI (blue) staining. Blank and red arrows illustrate mitotic catastrophe and nuclear fragmentation, respectively. Scale bars are shown in the figure (50 μm). Bar graphs represent the quantification of morphological findings of at least 200 cells for each condition. (C) Gene expression heatmap from qPCR array analysis of SET2 cells treated with reversine (5 μM). The mRNA levels are normalized to those of vehicle-treated SET2 cells and calculated as fold change in expression; genes demonstrating ≥1.5-fold in either direction compared to vehicle-treated cells upon the treatment with reversine are included in the heatmap. Two independent experiments of each condition were used for the analysis; green indicates repressed mRNA levels and red elevated mRNA levels. (D) qPCR analysis of BCL2, BCL2L1, BIRC5, BNIP3, BNIP3L, and BIK mRNA expression in SET2 and HEL cells treated with reversine (5 μM). The dashed line represents the mean gene expression in vehicle-treated cells and bars represent the fold change in gene expression in SET2 and HEL cells treated with reversine (5 μM) compared to their respective untreated cells. The p values and cell lines are indicated in the graphs. **p < 0.01, **p < 0.001; Student t test.

