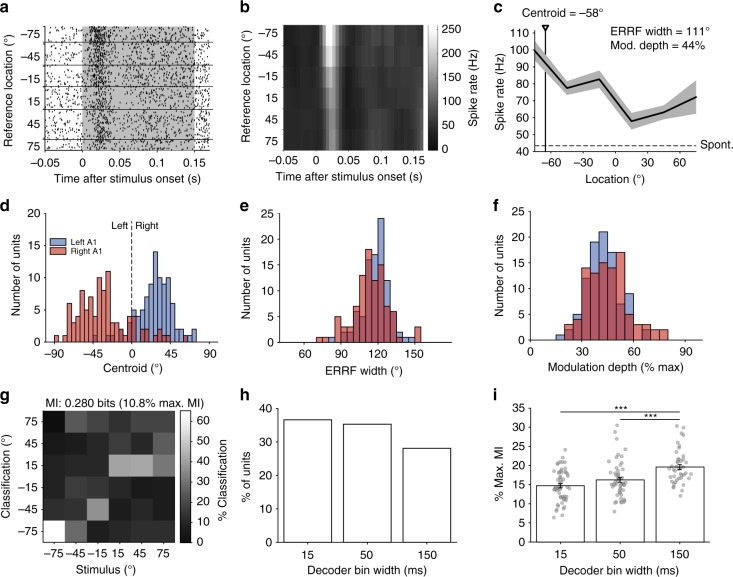
Fig. 3.
Spatial tuning properties in response to broadband noise. a Example, raster plot from one unit, with trials ordered by the location of the reference sound. The duration of stimulus presentation is indicated by the grey box. b Post-stimulus time histogram (spikes binned at 5 ms resolution). c Spatial receptive field (mean ± standard error of the mean (s.e.m.)) spike rate calculated over 150 ms at each location. The unit shows clear contralateral tuning and a centroid of −58° (black triangle/line). The equivalent rectangular receptive field (ERRF) width and modulation depth are also indicated in the figure. The dotted line represents the spontaneous firing rate. d Distribution of centroids, ERRF widths (e) and modulation depths (f) for all spatially modulated units (N = 190) split by left (blue, N = 95) and right (red, N = 95) auditory corttices (AC). g Stimulus location decoded with a Euclidean distance decoder on the spike response binned with 15 -ms resolution for the unit in a–c. The mutual information (MI) and percentage of maximum MI are indicated. h Distribution of best decoder bin widths for significantly informative units (N = 153). i Mean percentage of maximum MI ± s.e.m. of significant units from (h). Raw data are shown in grey circles. (N = 56, 54, 43). Statistics: one-way ANOVA with Tukey–Kramer post-hoc pairwise comparisons. ***p < 0.001

