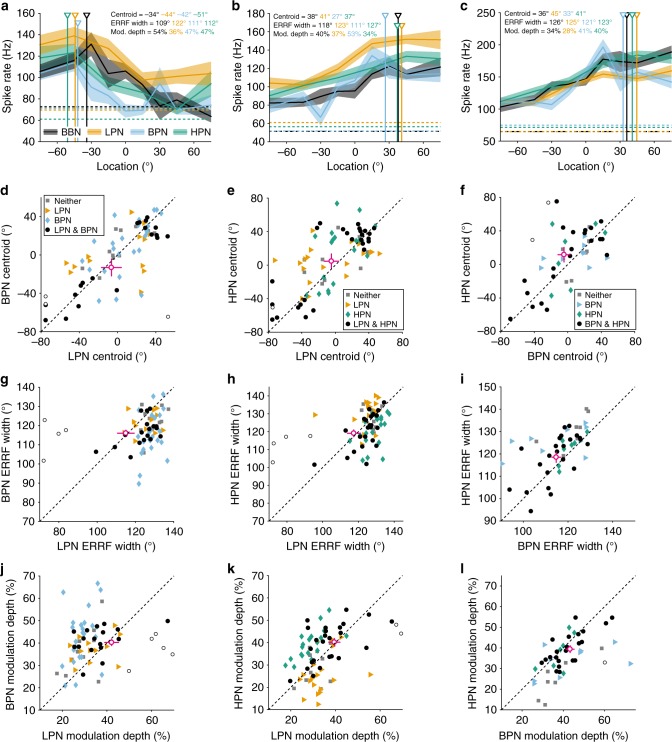
Fig. 4.
Comparison of spatial tuning properties between cue-restricted stimuli. a–c shows three example units recorded in all four cue conditions: broadband (BBN, grey), low-pass (LPN, orange), bandpass (BPN, blue) and high-pass (HPN, green). Centroid, ERRF width and modulation depth in each condition are indicated. The dotted lines represent the spontaneous firing rate. For panels d–l, units that were spatially tuned in both conditions (circles), either condition alone (diamonds or triangles) or tuned in neither (squares). Open circles indicate individual units that significantly changed between stimuli (non-parametric resampling, see Methods). Mean ± s.e.m. of the units spatially modulated in both conditions (i.e., of the black circles) is shown by cross-hairs (circle, magenta). d–f Centroids, ERRF width (g–i) and modulation depth (j–l) of units recorded in both LPN and BPN conditions (d, g, j; both spatially tuned N = 22, LPN tuned = 13, BPN tuned = 24, neither tuned = 11), LPN and HPN conditions (e, h, k; both spatially tuned N = 27, LPN tuned = 19, HPN tuned = 19, neither tuned = 10) and BPN and HPN conditions (f, i, l; both spatially tuned N = 23, BPN tuned = 9, HPN tuned = 7, neither tuned = 7)

