Fig. 5.
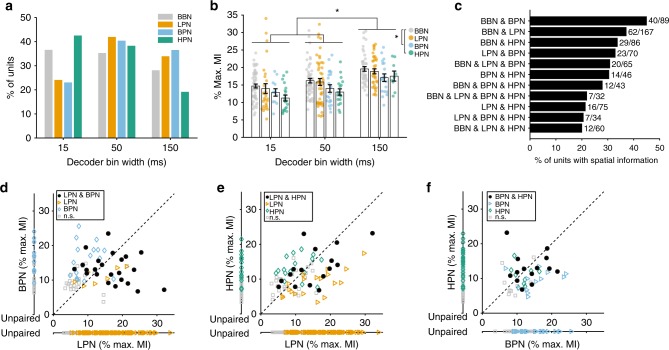
Comparison of spatial information in broadband and cue-restricted conditions. The amount of spatial information (MI) from stimuli with limited cues was compared with those where all cues were present (BBN) and between pairs of limited cue conditions. a Distribution of best decoder bin widths for all spatially informative units (BBN (N = 153), LPN (112), BPN (52), HPN (47)). b Mean percentage of maximum MI ± s.e.m. of units from (a). The raw data are shown by coloured circles. Statistics: two-way ANOVA with Tukey–Kramer post-hoc pairwise comparisons, asterisk (*) shows p < 0.05. c Proportion of units that showed information (in any bin width) in each combination of stimulus conditions. d Comparison of the mean percentage of maximum MI of units recorded in both low-pass (LPN) and bandpass (BPN. Paired: both significant N = 23, LPN sig. = 7, BPN sig. = 17, neither sig. = 23. Unpaired: LPN sig. = 82, not sig. = 92, BPN sig. = 12, not sig. = 15). e Low-pass and high-pass (HPN, paired: both significant N = 16, LPN sig. = 19, HPN sig. = 16, neither sig. = 24. Unpaired: LPN sig. = 77, not sig. = 92, HPN sig. = 15, not sig. = 24) and (f) BPN and HPN (paired: both significant N = 14, BPN sig. = 13, HPN sig. = 9, neither sig. = 10. Unpaired: BPN sig. = 25, not sig. = 26, HPN sig. = 24, not sig. = 44) conditions. Units that were only recorded in one condition are plotted along a separate axis. Units with significant MI in both conditions are shown as black circles, significant MI in only one of the conditions is indicated by triangles and diamonds. Grey squares show units not significantly informative in either condition

