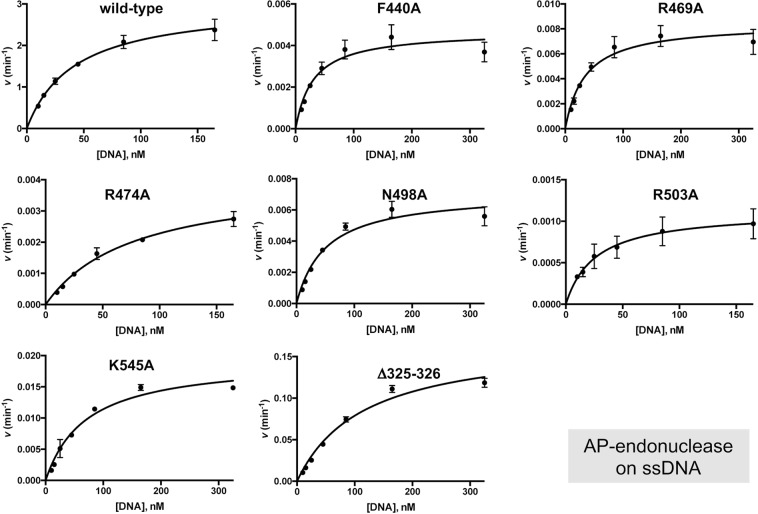
Figure 3.
Steady-state analysis of the AP-endonuclease activity of the PolXBs derivatives. The assay was performed as described in Materials and Methods. Graphics show the turnover values (v in min−1) plotted as a function of ssDNA concentration (32P-5′ labeled oligonucleotide THF-11P; see Materials and Methods). The data were fitted to the Michaelis–Menten equation by least-squares nonlinear regression, and the resulting kcat, Km and catalytic efficiency (kcat/Km) values are given in Table 1.

