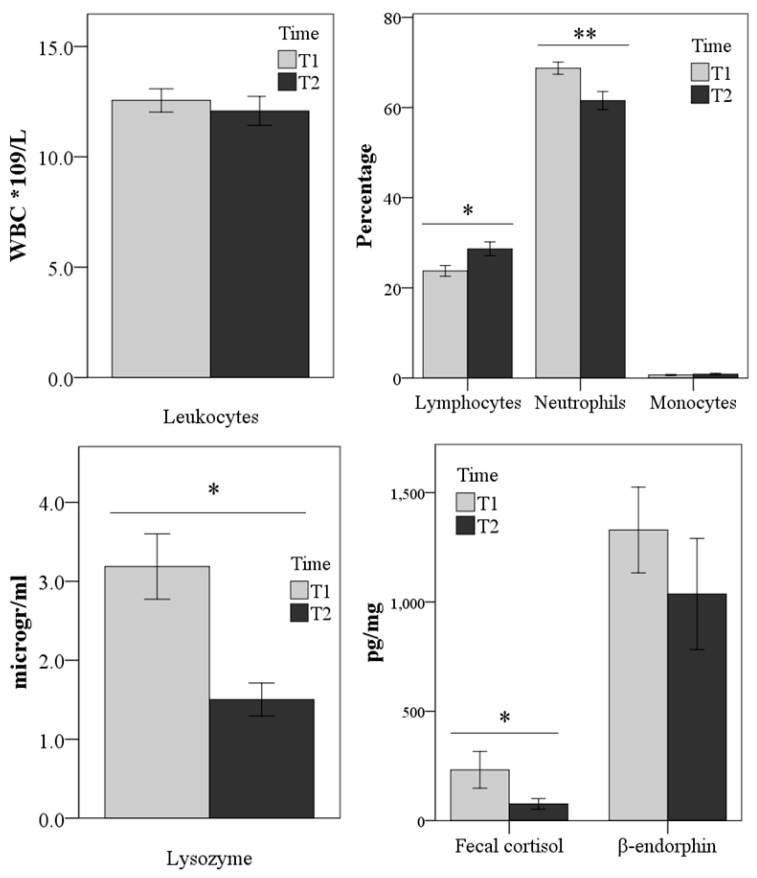
Figure 1.
Differences in laboratory parameter values between the first (three days of shelter intake, Time 1 = T1) and the second sampling (after four weeks of acclimation in the shelter, Time 2=T2). ** p < 0.01, * p < 0.05 (univariate analysis). Basophils are not represented because they were constant.

