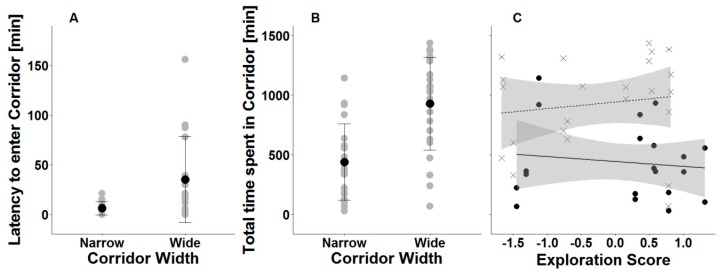
Figure 2.
Movement in the corridor system. (A) Original values, means, and standard error of latencies of N = 33 to enter the corridor for the first time depending on corridor width. (B) and (C) The total time NDay1 = 22 and NDay2 = 21 male common voles spent in a grassland corridor within 24 h. (B) Original values, means, and standard error. (C) Modelled values from mixed effects model, including the terms month and experimental day (two days per individual) as covariates, with ID and ID of the second male in pair as random factors. Dots represent animals in the narrow corridor and crosses represent animals in the wide corridor. Each animal is represented by two symbols (same exploration score, but different days). The solid line represents the regression slope for the narrow corridor and the dashed line represents the regression slope for the wide corridor. The grey bands display the confidence interval of the model.

