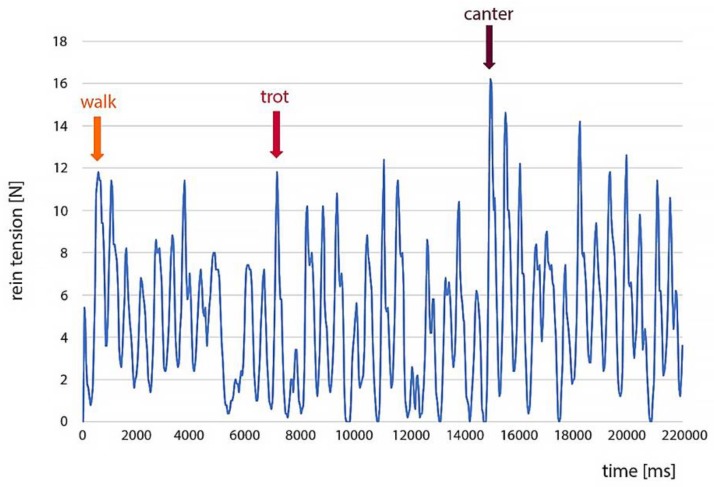
Figure 3.
Raw data of a rein tension measurement while riding on the left hand; the data show an oscillating pattern for each gait; the first arrow indicates the start of the walk-phase, the second arrow indicates the transition from walk to trot, and the third arrow indicates the transition from trot to canter.

