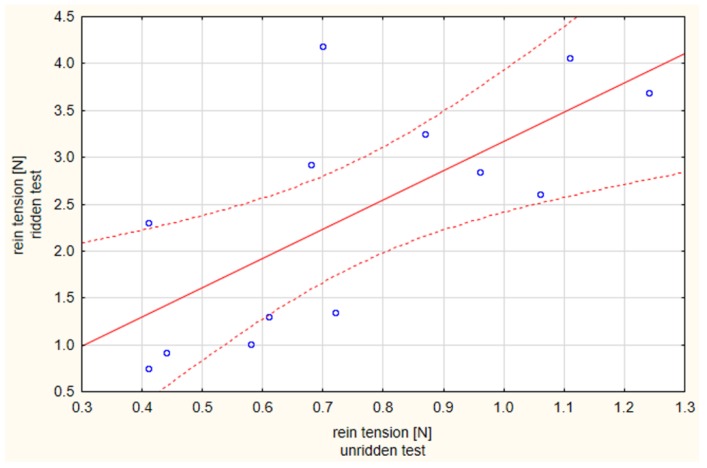
Figure 5.
Correlation between the rein tension in the unridden and ridden state; correlation coefficient r = 0.702, p < 0.05; a positive linear relation between the rein tensions in the unridden and ridden state is shown in the scatterplot, circles represent results of individual horses; the dotted lines indicate the 95% confidence interval.

