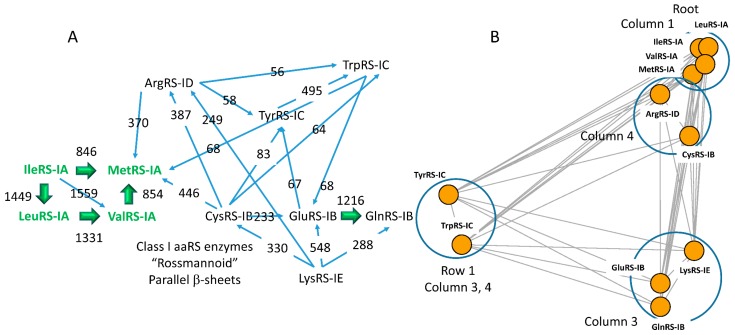
Figure 7.
Homology and radiation of class I aaRS enzymes. Two representations of the network are shown. (A) A hand-drawn representation. Enzymes that have editing active sites are in green and bold type. The direction of the arrows is from the query→target aaRS. The numbers reported are the Phyre2 homology scoring function (Table 2). The larger the number, the better the match. The directionality of the arrows generally indicates the highest score obtained in Phyre2 homology searches, which were done in both directions. (B) Igraph representation. Distances represent evolutionary distances (Kamada and Kawai settings) [51]. Circles indicate related aaRS enzymes grouped in genetic code columns and rows.

