
Figure 1.
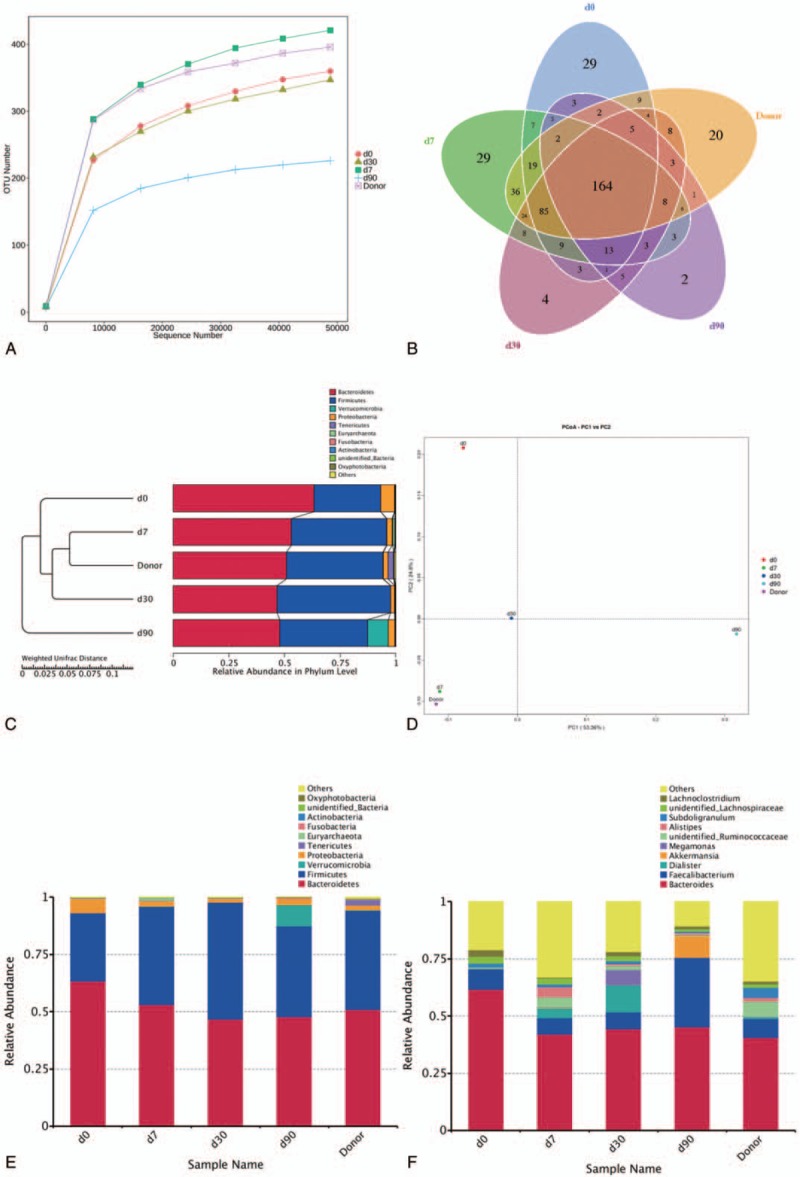
Microbiota analysis. Fecal microbial communities of the patient before FMT, at 1 wk after FMT, 1 mo after FMT and 3 mo after FMT. (A) Alpha diversity of observed species; (B) Venn diagram of shared and independent bacterial OTUs during different periods; (C) Weighted unifrac tree analysis, differences in the clustering of bacterial communities by the UPGMA; (D) PCoA; each dot represents 1 fecal sample; dot closeness indicates the similarity between bacterial communities. (E, F) Relative abundance of fecal bacterial taxa on phylum and genus levels, respectively. FMT = fecal microbiota transplantation, PCoA = principal co-ordinates analysis, UPGMA = unweighted pair group method with arithmetic mean.