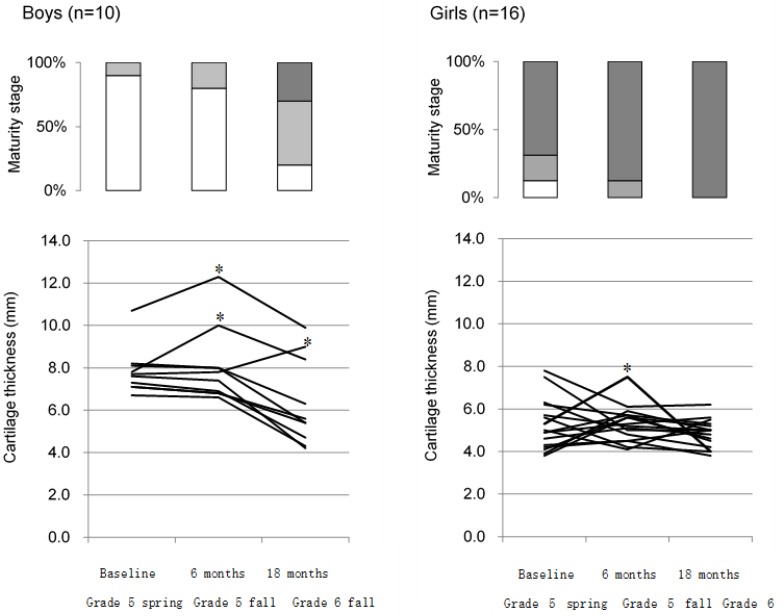
Figure 3.
Percentage of students in each maturity stage and changes in cartilage thickness of each student at each examination time point from the longitudinal survey of grade 5 students (n = 26) by sex. Maturity stage (upper panel); Cartilaginous stage  , Apophyseal stage
  , Epiphyseal stage
  . * Measurement points showing ≥20% consecutive increases in cartilage thickness from the previous measurement during observation. A girl who showed ≥20% consecutive increases in cartilage thickness in grade 5 fall developed OSD.

