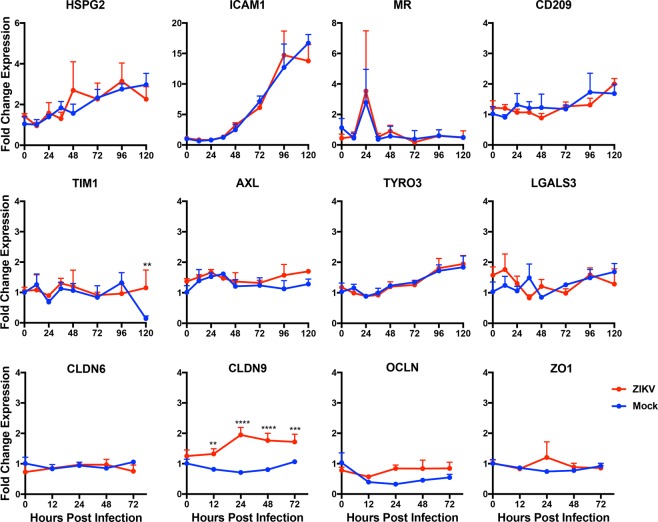
Figure 3.
Expression of Fcγ before and after ZIKV infection of human Schwann cells. (A) hSC cells were infected with ZIKV Fortaleza at an MOI of 5 and Fcγ receptor mRNA was measured by qRT-PCR. CT values were normalized to Gapdh, and fold change was calculated relative to uninfected 0-hour (ΔΔCT) data. Each value represents the mean +/− SD from three independent experiments. (B) hSC cells were stained with Fcγ receptor-specific antibodies and analyzed by flow cytometry. The blue line in the histogram corresponds to specific staining with the receptor antibody while the red line corresponds to staining with the isotype control antibody. Data are representative of 3 independent sets of experiments.

