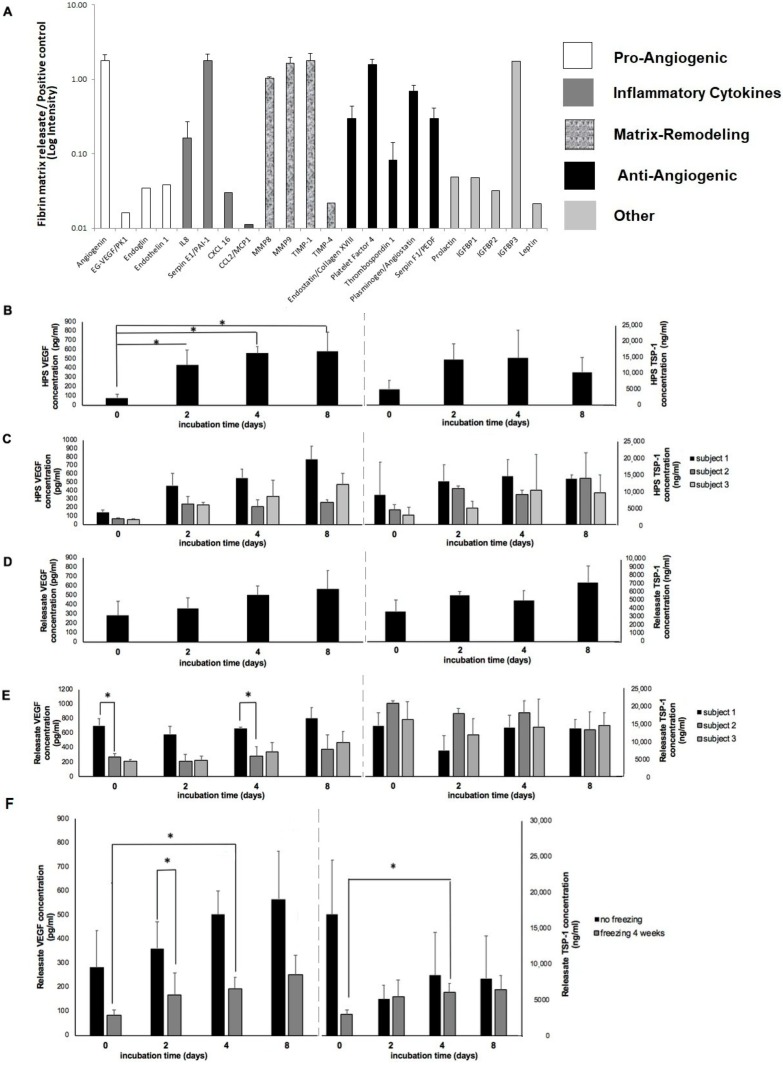
Figure 3.
Proteomic analysis of fibrin matrix releasates and the effect of varying blood incubation time on HPS and HPS–fibrin hydrogel releasate VEGF/TSP-1 concentration. (A) Plot showing the proteomic profile of factor proteins detected in releasates of fibrin hydrogels that were incubated for 7 days in the presence of PBCs cultured under hypoxia (3% O2) (n = 3). (B) Plot showing HPS VEGF and TSP-1 concentrations for blood incubation times of 0, 2, 4, and 8 days, * = p < 0.01 (n = 5). (C) Plot showing individual subject analysis of HPS VEGF and TSP-1 concentrations for the previous conditions (n = 3). (D) Plot showing HPS–fibrin hydrogel releasate VEGF and TSP-1 concentrations for blood incubation times of 0, 2, 4, and 8 days (n = 5). (E) Plot showing individual subject analysis of HPS–fibrin hydrogel releasate VEGF and TSP-1 concentrations for the previous conditions, * = p < 0.05 (n = 3). (F) Plot comparing the VEGF and TSP-1 concentrations in releasates of HPS–fibrin hydrogels immediately after the preconditioning period (0, 2, 4, and 8 days) and following storage for 4 weeks at −20 °C degrees, * = p < 0.05 (n = 5). Error bars represent s.d.

