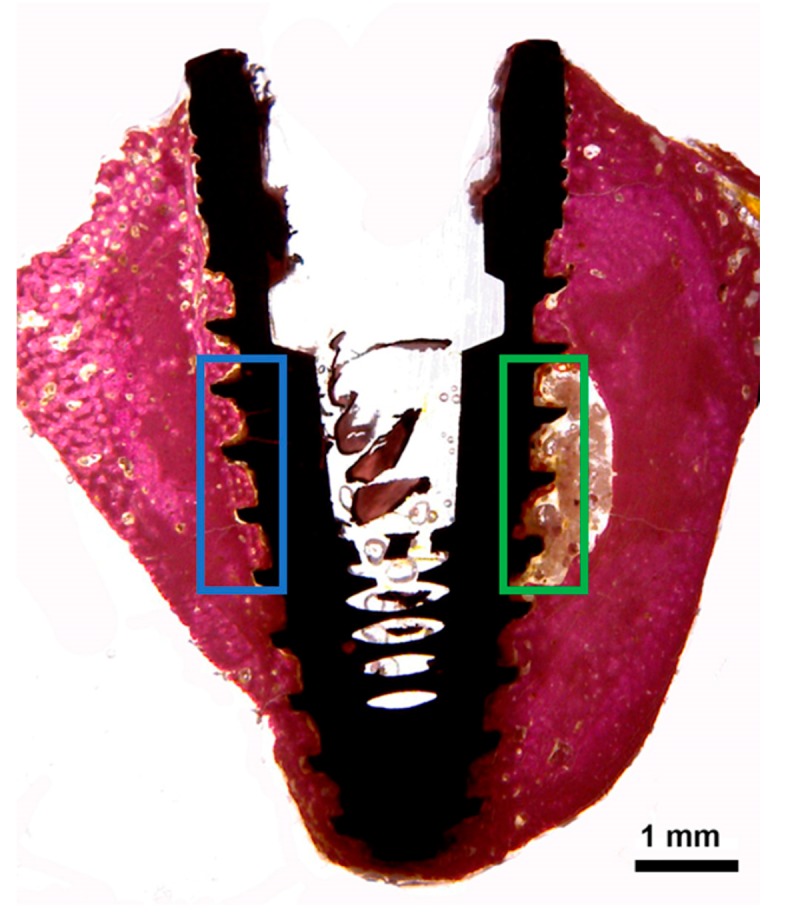
Figure 4.

Schematic image to show the areas in the center of the implants that were evaluated by descriptive method. The blue rectangle represents side 1 (implant near the cortical bone), and the green rectangle represents side 2 (implant in contact with the medullar bone portion).
