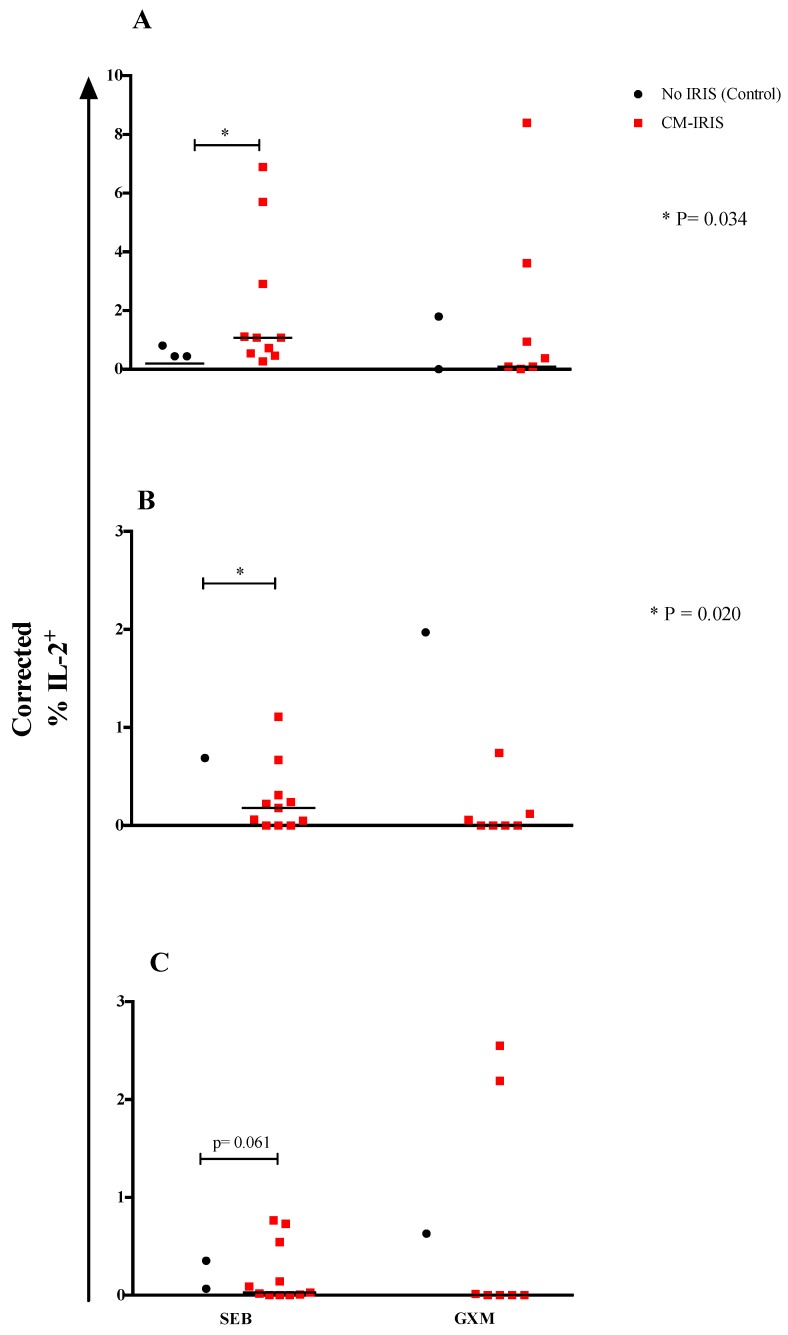
Figure 3.
Corrected IL-2 responses by total CD8+ T cells (A), naïve CD8+ T cells (B) and CD8+ TDEM T cells (C) were calculated by subtracting the value for unstimulated samples from the value for mitogen- or IFN-γ-stimulated samples of subjects who developed CM-IRIS compared to controls at baseline. Negative corrected values were reported as zero. Individual responses are shown with the median as a black horizontal line. p-values were determined using the Mann Whitney U test.

