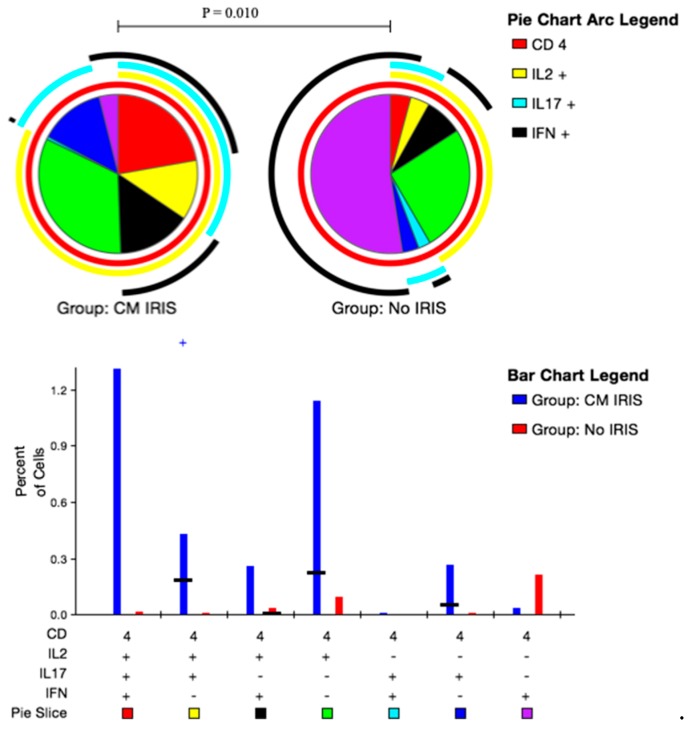
Figure 4.
Peripheral blood mononuclear cells from subjects with cryptococcal meningitis were stimulated with Glucuronoxylomannan (GXM). Intracellular Interleukin-2 (IL-2), IL-17 and Interferon-γ (IFN-γ) expression by CD4+ T cells was quantified using flow cytometry. The bar chart shows each of the three possible combination responses on the x-axis. The percentage of the total cytokine response is shown on the y-axis, with the filled bar representing the interquartile range and a black line at the median. Statistically significant differences (p < 0.05) by rank-sum testing are indicated by the plus sign. Responses from ART matched control subjects who did not develop CM-IRIS are shown in blue, responses from subjects with CM-IRIS are in red on the bar graph. The pie charts show the fractions according to the pie-slice colors shown at the bottom of the bar chart, with color-coded arcs indicating the contributions of IL-2 (yellow), IFN-γ (black), and IL-17 (cyan) to the 3-, 2- and 1-function responses. Statistical comparisons of the overall responses by permutation testing are shown in the pie category test result chart where the red represents IL-2+IL-17+IFN-γ+ CD4+ T cells; yellow represents IL-2+IL-17+IFN-γ− CD4+T cells; black represents IL-2+IL-17−IFN-γ+ CD4+ T cells; green represents IL-2+IL-17−IFN-γ− CD4+ T cells; cyan represents IL-2−IL-17+IFN-γ+ CD4+ T cells; blue represents IL-2−IL-17+IFN-γ− CD4+ T cells and purple represents IL-2−IL-17−IFN-γ+ CD4+ T cells. Patients with CM-IRIS had a significantly elevated proportion of duo functional IL-2+IL-17+IFN-γ− CD4+T cells compared with matched Controls following GXM stimulation.

