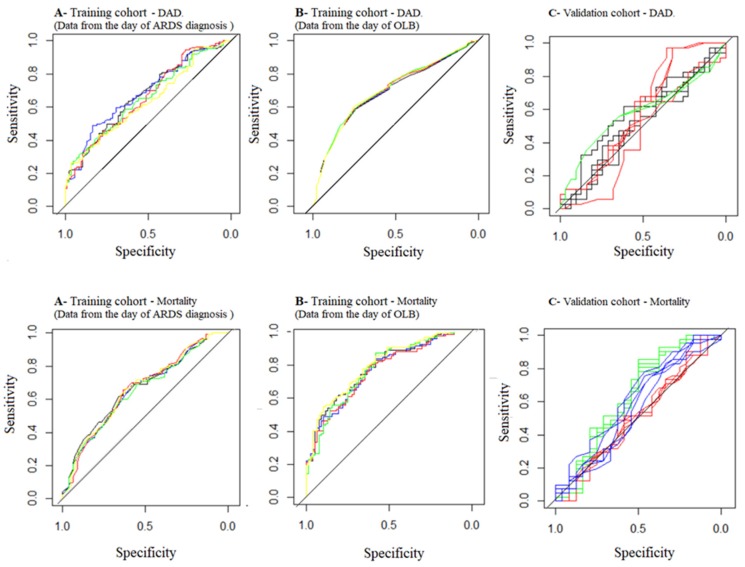
Figure 1.
Receiver operating curves (ROC) for predicting diffuse alveolar damage. Upper line diffuse alveolar damage. (A) Training cohort. Data from the day of ARDS diagnosis (black: dataset 1; blue: dataset 2; red: dataset 3, green: dataset 4 and yellow: dataset 5). (B) Training cohort. Data from the day of OLB (black: dataset 1; blue: dataset 2; red: dataset 3, green: dataset 4 and yellow: dataset 5). (C) Validation cohort. The five data sets from each model are painted with the same color (black: Lorente’s model, red: day of ARDS, green: day of OLB). Lower line mortality. (A) Training cohort. Data from the day of ARDS diagnosis (black: dataset 1; blue: dataset 2; red: dataset 3, green: dataset 4 and yellow: dataset 5). (B) Training cohort. Data from the day of OLB (black: dataset 1; blue: dataset 2; red: dataset 3, green: dataset 4 and yellow: dataset 5). (C) Validation cohort. The five dataset from each model are painted with the same color (red: day of ARDS, green: day of OLB, blue; Kao et al. model).

