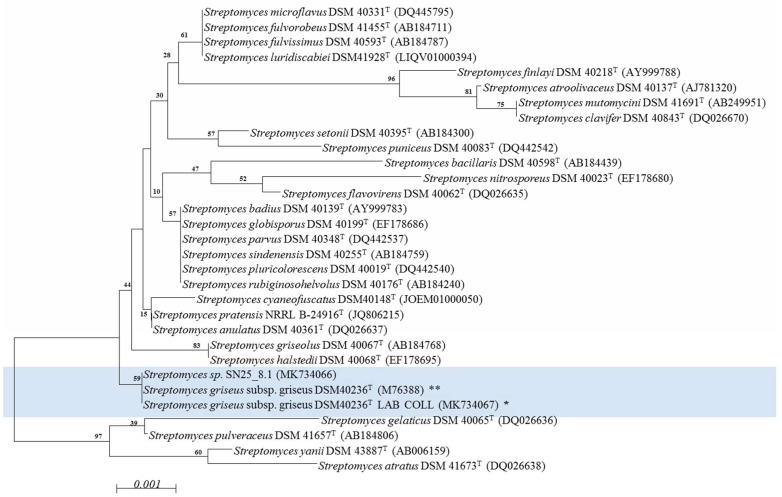
Figure 1.
Phylogenetic characterization of the Streptomyces strains using a neighbor joining model. Light blue: experimentally compared Streptomyces strains. Bootstrap = 1000; Bootstrap values are shown on the branch, where 100 is maximum; T: type strain; NCBI access number is within parenthesis. * Streptomyces griseus subsp. griseus DSM 40236T LAB COLL: Sequence experimentally obtained from fresh cultures and deposited in NCBI (MK734067). ** Streptomyces griseus subsp. griseus DSM 40236T: Sequence retrieved from NCBI (M76388). The evolutionary distances were computed using the Jukes-Cantor method and are in the units of the number of base substitutions per site (scale). The analysis involved 31 nucleotide sequences. All positions containing gaps and missing data were eliminated. There were a total of 1338 positions in the final dataset.

