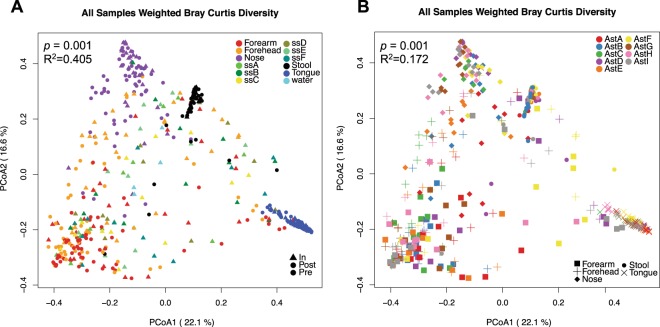
Figure 2.
Principal coordinate plots of weighted Bray-Curtis beta diversity distances across all samples collected in the study. (A) Samples colored by body or ISS surface site; The permanova p-value and R2 using body site as the independent variable is shown. (B) Human microbiome samples colored by astronaut identifier. Each microbiome is represented with a different symbol. Permanova p-value and R2 using astronaut identifier as the independent variable and stratifying by body site are indicated.

