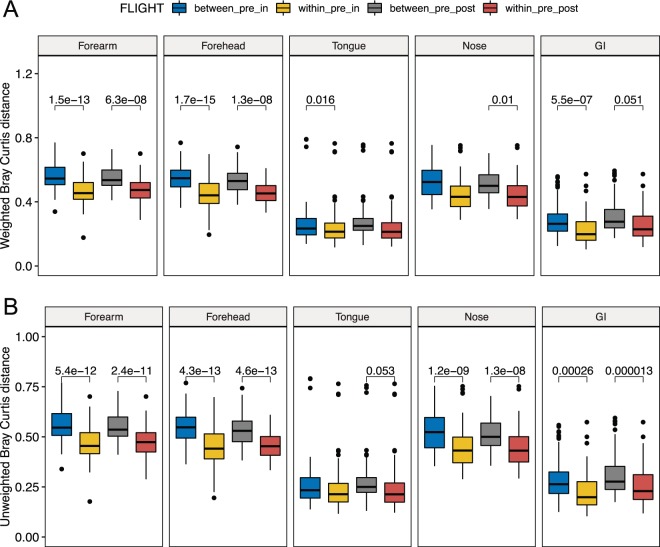
Figure 4.
Changes in beta diversity of the astronauts’ microbiome. Boxplots showing differences in weighted (A) and unweighted (B) Bray-Curtis beta diversity distances among microbiome samples within and between mission stages. Within_pre_in, within preflight and within inflight distances; between_pre_in, distances between preflight and inflight samples; between_pre_post, distances between preflight and postflight samples; within_pre_post, distances within preflight and within inflight samples. Linear mixed-effects model p-values ≦ 0.06 are depicted using within_pre_in or within_pre_post as baselines.

