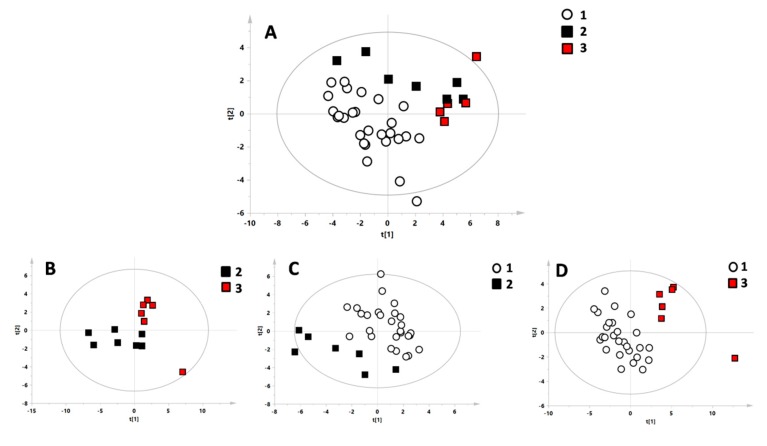
Figure 1.
Multivariate statistical models of the different investigated classes. (A) Model with all three group: white circles = Group 1 (control), black boxes = Group 2 (heterozygous for β-thalassemia), and red boxes = Group 3 (homozygous for β-thalassemia). (B) Model comparing heterozygous and homozygous for β-thalassemia. (C) Model comparing the control group and heterozygous for β-thalassemia. (D) Model comparing the control group and homozygous for β-thalassemia.

