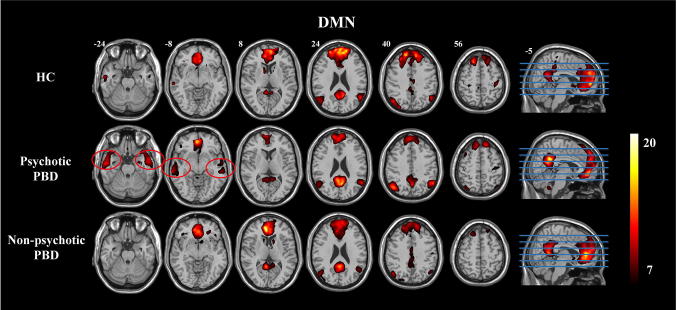
Fig. 1.
One-sample t-test results for group-level DMNs in the control (HC), psychotic PBD, and non-psychotic PBD groups. Connectivity scores in the bilateral MTG (red circles) were higher in the psychotic PBD group. The color scale represents t values in each DMN (maps thresholded at P < 0.001, FWE corrected).

