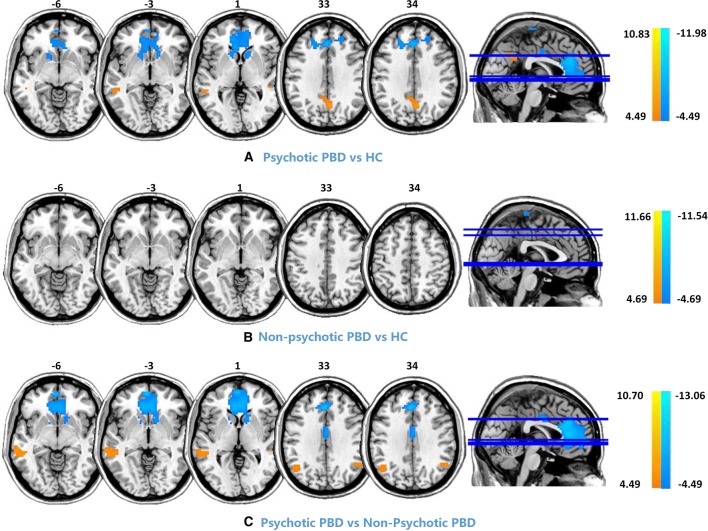
Fig. 3.
Post-hoc comparison (P < 0.001, FDR corrected) of intra-network connectivity among the three groups [control (HC), psychotic PBD, and non-psychotic PBD]. Compared with the controls, patients with psychotic PBD displayed significantly increased connectivity in the left MTG and PCC, as well as decreased connectivity in the ACC/mPFC and bilateral caudate nucleus. Compared with the non-psychotic PBD patients, the psychotic PBD patients showed increased connectivity in the left MTG and bilateral angular gyri, as well as decreased connectivity in the ACC and bilateral caudate nucleus. The color scale represents t values.

