Fig. 3.
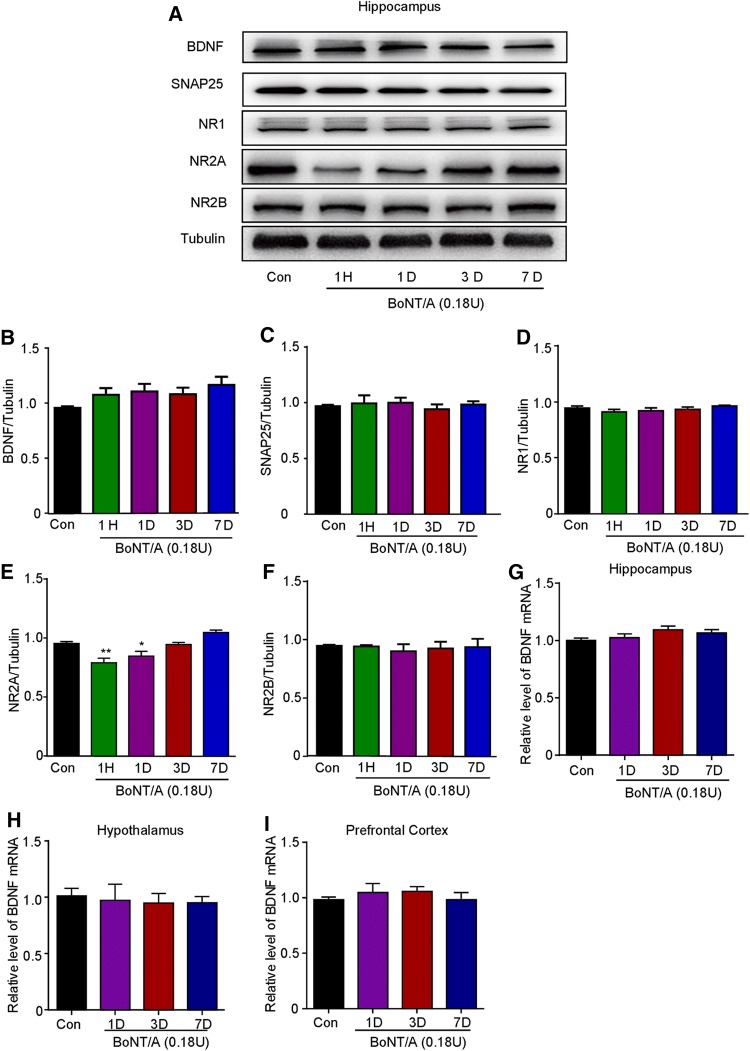
Effects of BoNT/A treatment on the expression of BDNF, SNAP25, and NMDA receptors in the brain of naïve mice. A Representative western blots showing the protein expression of BDNF, NMDA receptors, and SNAP25 in the hippocampus of naïve mice at different time points after BoNT/A treatment. B–F Semi-quantitative analysis showing the effects of BoNT/A on the expression of BDNF (B), NR1 (C), NR2A (D), NR2B (E), and SNAP25 (F) in naive mice. *P <0.05, **P <0.01 compared with controls (one-way ANOVA with post-hoc Bonferroni test). The data are presented as mean ± SEM, n = 6. G–I mRNA expression of BDNF determined by q-PCR in the hippocampus (G), hypothalamus (H), and prefrontal cortex (I). The data are presented as mean ± SEM, n = 5–6.

