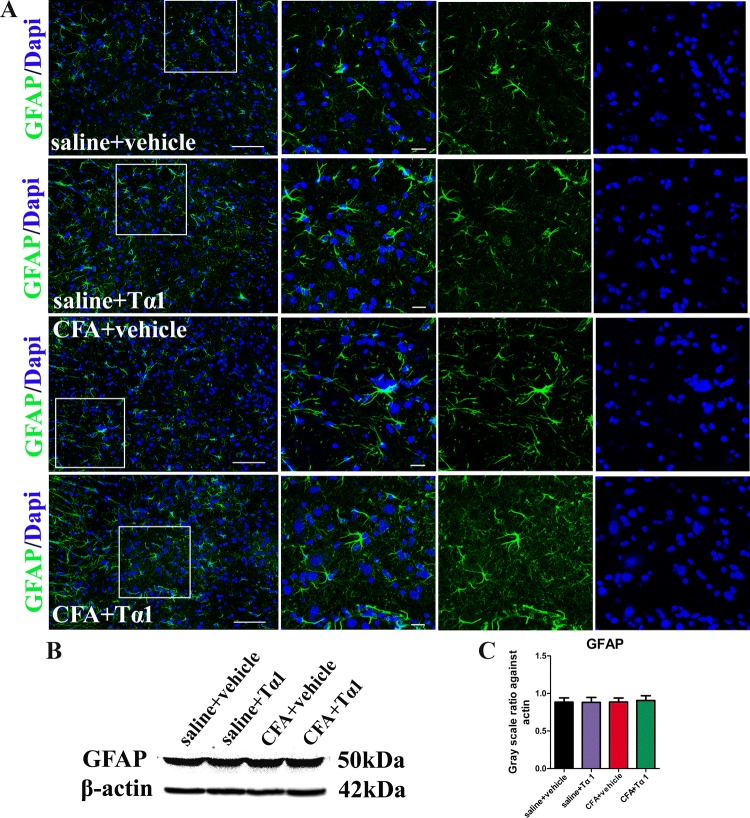
Fig. 5.
Results for GFAP activation treated with a combination of Tα1 and CFA. A GFAP immunoreactivity in the spinal cord of mice treated with saline + vehicle, saline + Tα1, CFA + vehicle, and CFA + Tα1 (scale bars, 100 μm for the left panels and 50 μm for the right three-column panels). B Representative gel images of GFAP in the spinal cord. C GFAP expression in the spinal cord. Data are expressed as mean ± SEM (n = 5/group).

