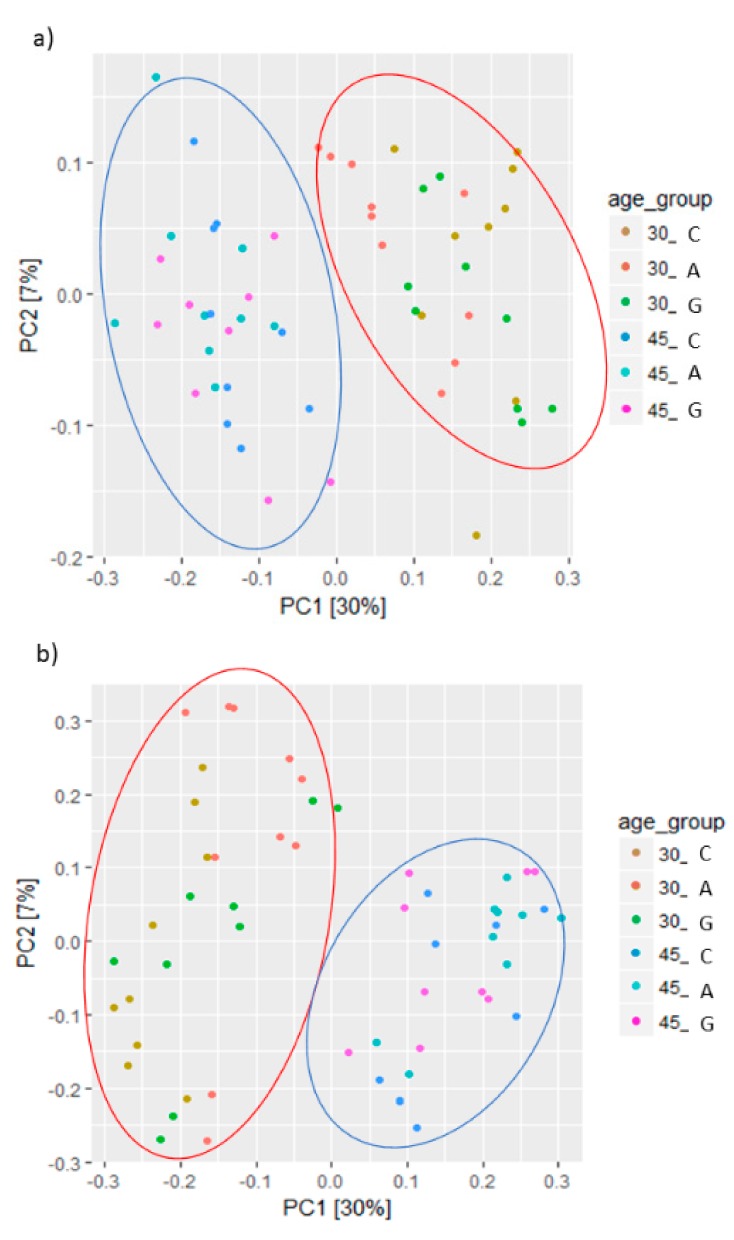
Figure A2.
MDS plots of the rarefy weighted UniFrac distances (a) and Bray–Curtis distances (b) of caecal microbiota of rabbit fed a dietary supplementation of dehydrated alfalfa or fresh grass in peri-weaning period (those at 30 and 45 days of age were analyzed). Principal component (PC)1 and PC2 values for each sample are plotted; the percentage variation explained by each PC is shown in brackets. C = rabbit fed pelleted feed only; A = rabbit fed pelleted feed + dehydrated alfalfa; G = rabbit fed pelleted feed + fresh grass.

