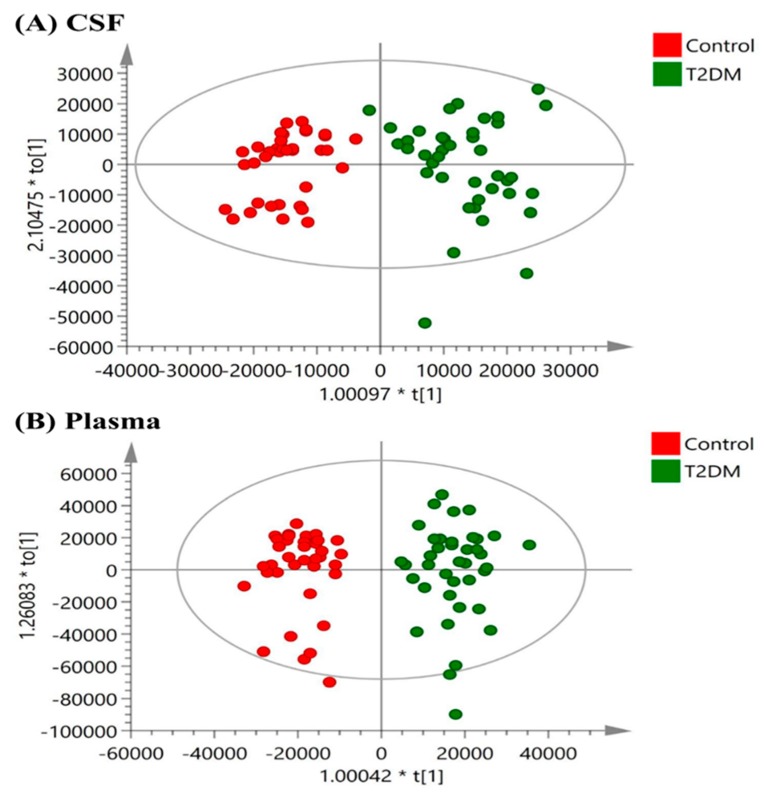
Figure 2.
Orthogonal partial least-squares discriminant analysis (OPLSDA) score plots in (A) CSF (reliability: R2X = 0.757, R2Y = 0.852, Q2 = 0.677) and (B) plasma (reliability: R2X = 0.905, R2Y = 0.904, Q2 = 0.733) samples obtained from T2DM patients versus controls. The OPLSDA plots show a clear separation between T2DM and the control group in CSF and plasma samples.

