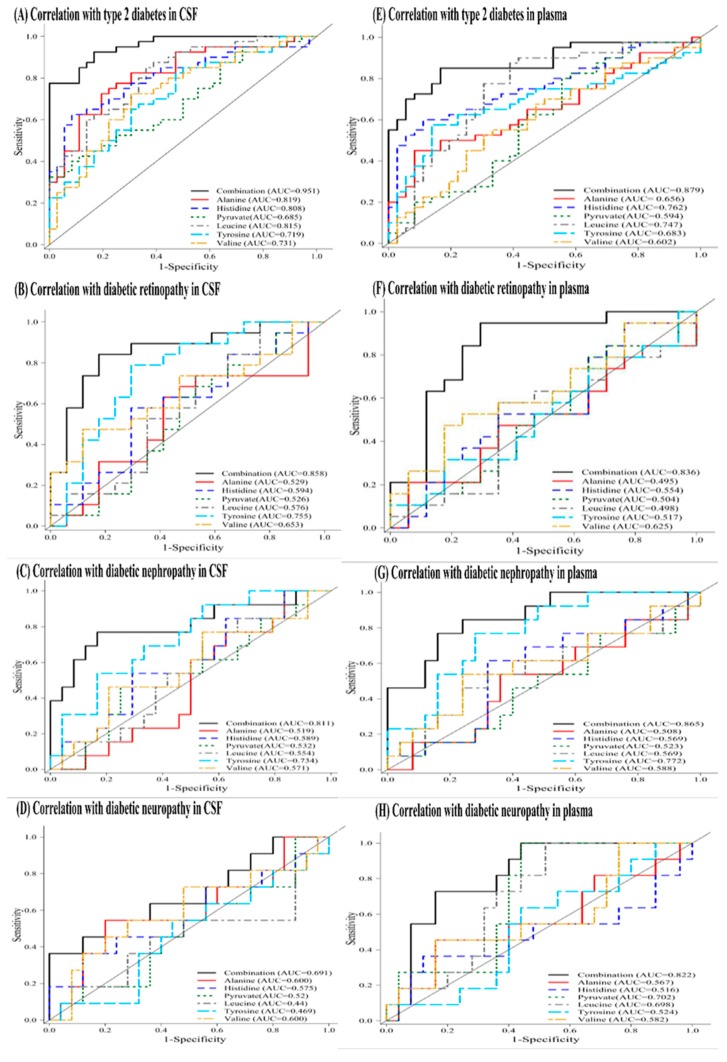
Figure 4.
Receiver operating characteristic (ROC) curve of six-metabolite combination for correlation with the presence of type 2 diabetes and diabetic microangiopathy (retinopathy, nephropathy, and neuropathy) in CSF (A–D) and plasma (E–H) samples. The six-metabolite combination consists of alanine, histidine, leucine, pyruvate, tyrosine, and valine. Each subfigure consists of seven correlation curves including six single metabolite and their combination.

