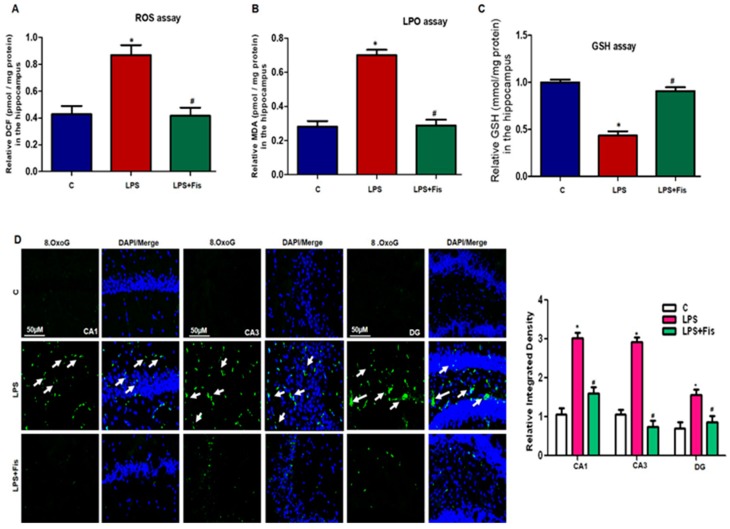
Figure 3.
Effect of fisetin treatments on lipopolysaccharide (LPS)-induced oxidative stress in a mouse brain. (A) The graph represents the levels of reactive oxygen species (ROS) accumulation in the hippocampi of adult mice. The results were shown as the means ± SEM (number = 8 mice/group) for three repeated and reproducible independent experiments. (B) The graph represents the levels of malondialdehyde (MDA) in the hippocampi of adult mice. The results were shown as the means ± SEM (number = 8 mice/group) for three repeated and reproducible independent experiments. (C) The graph represents the levels of glutathione (GSH) in the hippocampi of adult mice. The results were shown as the means ± SEM (number = 8 mice/group) for three repeated and reproducible independent experiments. (D) Representative images of immunofluorescence of 8-OxoG (green, FITC; blue, 4′, 6′-diamidino-2-phenylindole (DAPI)) in the CA1 (molecular layer and pyramidal cells), CA3 (molecular layer and pyramidal cells) and DG (hilum and granular cells) regions of the hippocampi of adult mice. The results were shown as the means ± SEM (number = 5 mice/group) for three repeated and reproducible independent experiments. Magnified 10×. Scale bar = 50 μm. * shows a significant difference between control and LPS-treated groups; # shows a significant difference between LPS-treated and LPS+Fis-treated groups. Significance = p < 0.05.

