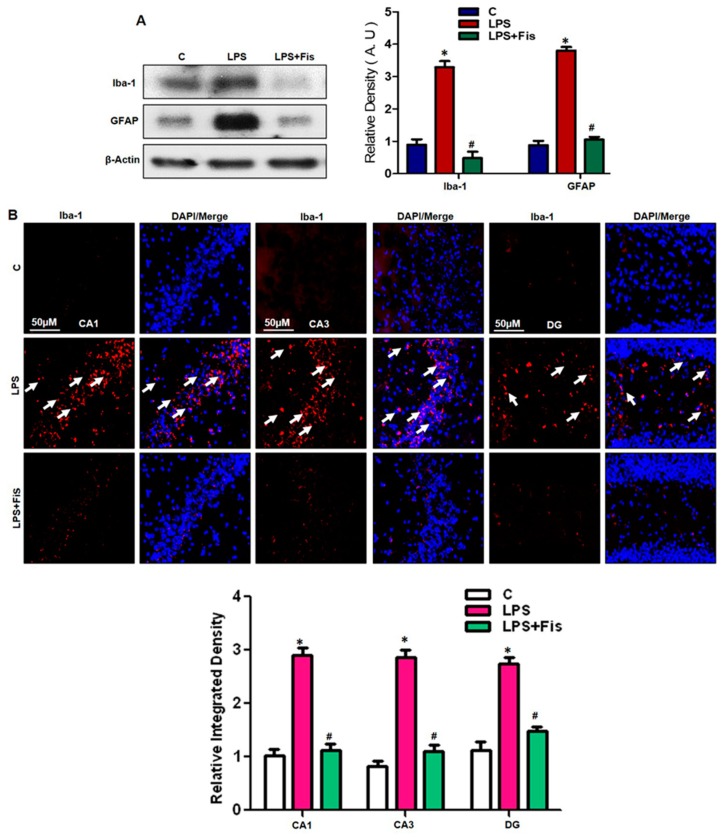
Figure 5.
Effect of fisetin on LPS-induced activation of microglia and astrocytes in the adult mouse hippocampus. (A) The Western blot analysis of microglia (Iba-1) and astrocyte (GFAP) antibodies were quantified using Sigma Gel software, and the differences are represented by a histogram. β-actin was used as a loading control. The density values are expressed in arbitrary units (A.U.) as the means ± SEM (number = 8 mice/group) for three repeated and reproducible independent experiments. (B) The representative image of immunofluorescent staining of Iba-1 in the CA1 (molecular layer and pyramidal cells), CA3 (molecular layer and pyramidal cells), and DG (hilum and granular cells) regions of the hippocampi of adult mice. The results were shown as the means ± SEM (number = 5 mice/group) for three repeated and reproducible independent experiments. Magnified 10×. Scale bar = 50 μm. * shows a significant difference between control and LPS-treated groups; # shows a significant difference between LPS-treated and LPS+Fis-treated groups. Significance = p < 0.05.

