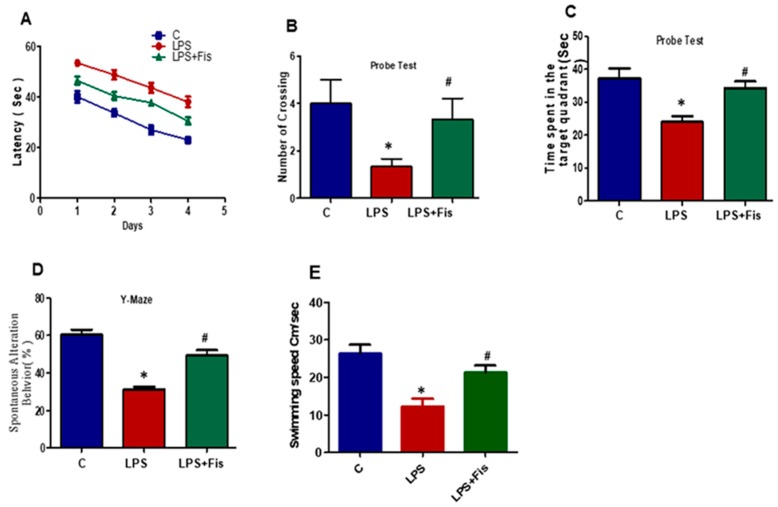
Figure 10.
Effect of fisetin on LPS-induced memory dysfunction. The behavioral studies were performed through the Morris water maze (MWM) and the Y-maze test. The mice (13 mice per group) were used for the behavioral analysis. (A) The time taken (escape latency (s)) to reach the submerged hidden platform during training. (B) The number of platform crossings during the probe test. (C) The graphs represent the time spent in the target quadrant (where the platform was located during the hidden platform training session) during the probe test. (D) The graphs represent the % of spontaneous alternation behavior in the Y-maze test. (E) Represents the mean swim speeds during training days. The graphs express the means ± SEM (n = 13 mice/group). * shows a significant difference between control and LPS-treated groups; # shows a significant difference between LPS-treated and LPS+Fis-treated groups. Significance = p < 0.05.

