
Figure 4.
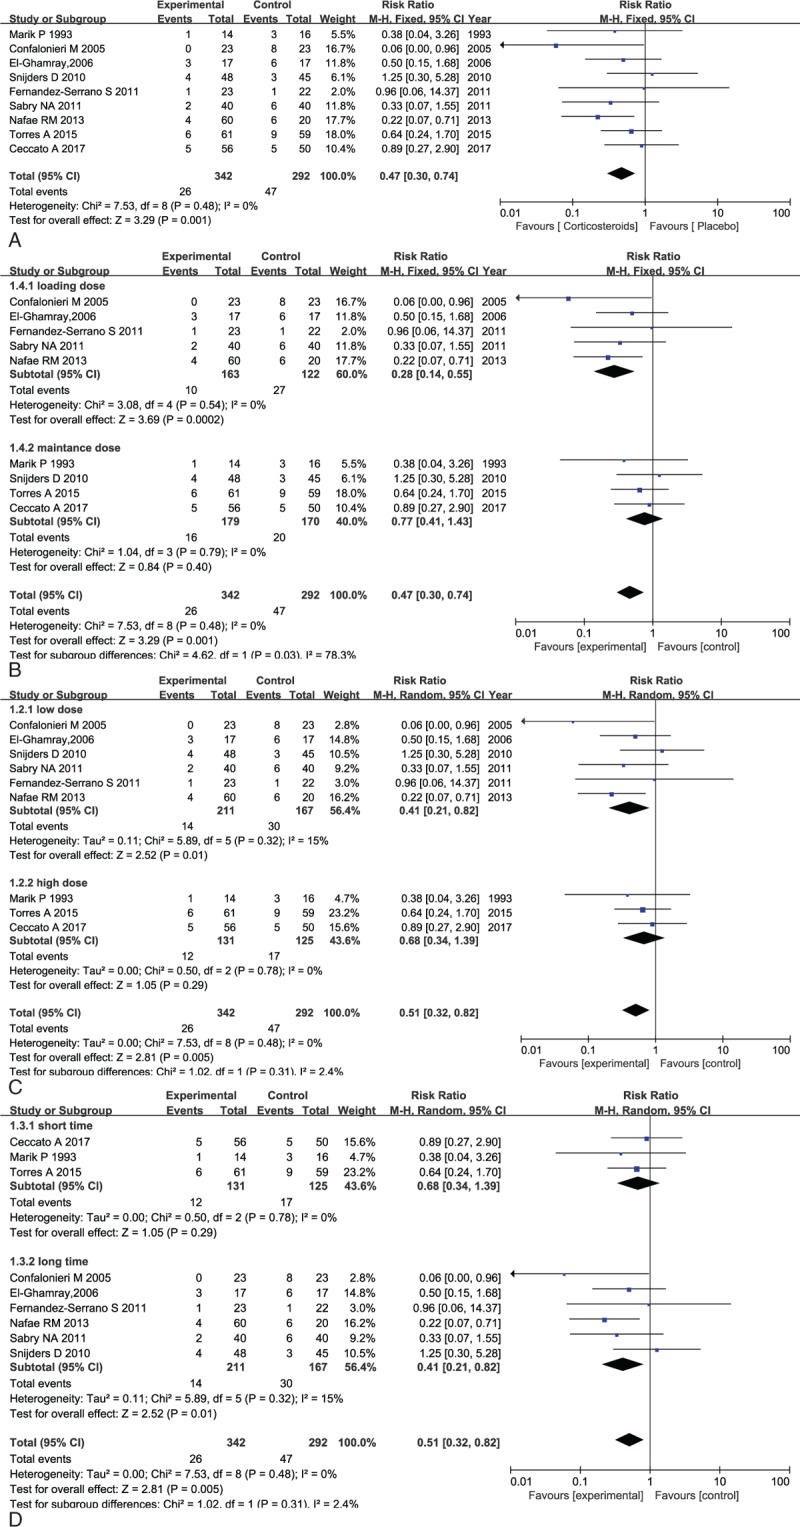
(A) Forest plot comparing all-cause mortality in patients with corticosteroid versus placebo. (B) Forest plot for the subgroup analysis of death on drug delivery of corticosteroid applied in patients with severe CAP. (C) Forest plot for the subgroup analysis of death on therapeutic dose of corticosteroid applied in patients with severe CAP. (D) Forest plot for the subgroup analysis of death on duration of corticosteroid applied in patients with severe CAP.