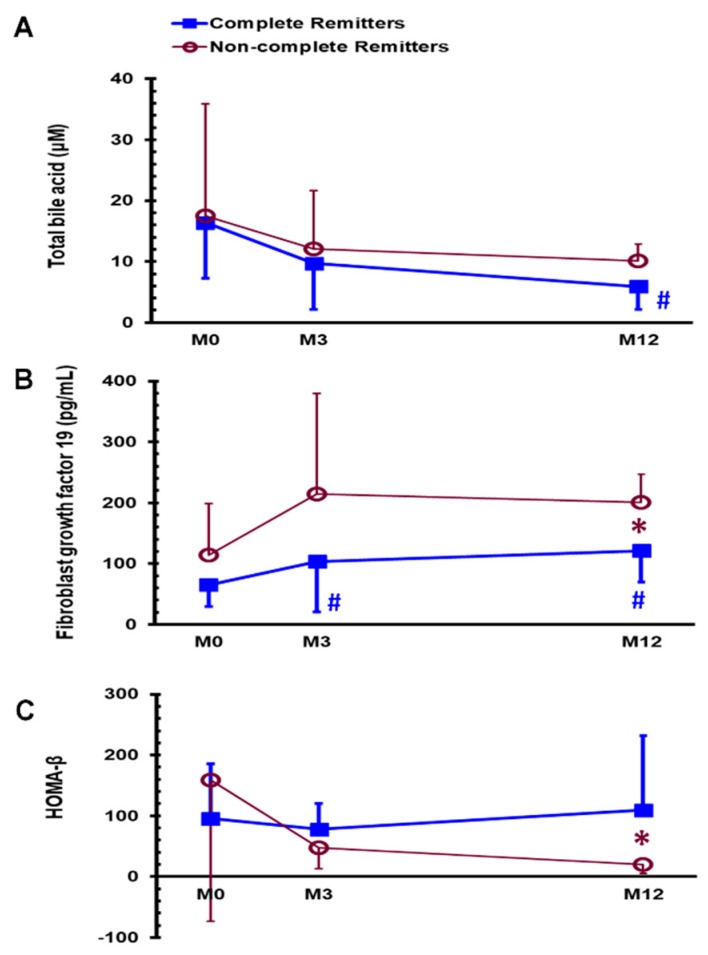
Figure 3.
Serum levels of total bile acid (A) and fibroblast growth factor 19 (B) and HOMA-β index (C) in the DM-CR and DM-non-CR groups before (M0) and 3 months (M3) and 1 year (M12) after sleeve gastrectomy. * p < 0.05 compared between the DM-CR and DM-non-CR groups, # p < 0.05 compared with MDM-CR, complete remitters of diabetes mellitus; DM-non-CR, non-complete remitters of diabetes mellitus; HOMA-β, homeostasis model assessment-β.

