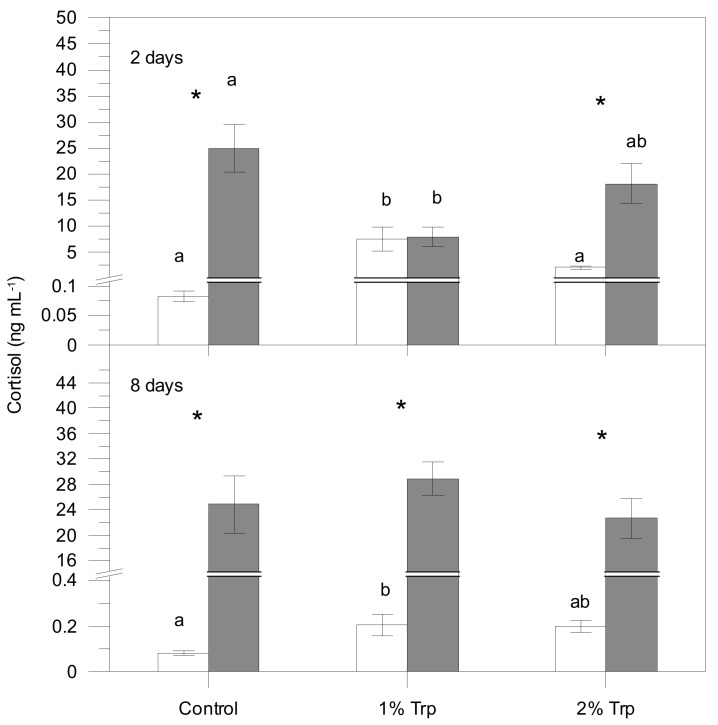
Figure 1.
Plasma cortisol concentration for each treatment (mean ± SE). White and grey bars are pre- and post-stress values, respectively. Asterisks indicate significant differences between pre- and post-stress conditions. Different letters indicate significant differences among groups (different experimental feeds) within each sampling (pre- and post-stress).

