Figure 1.
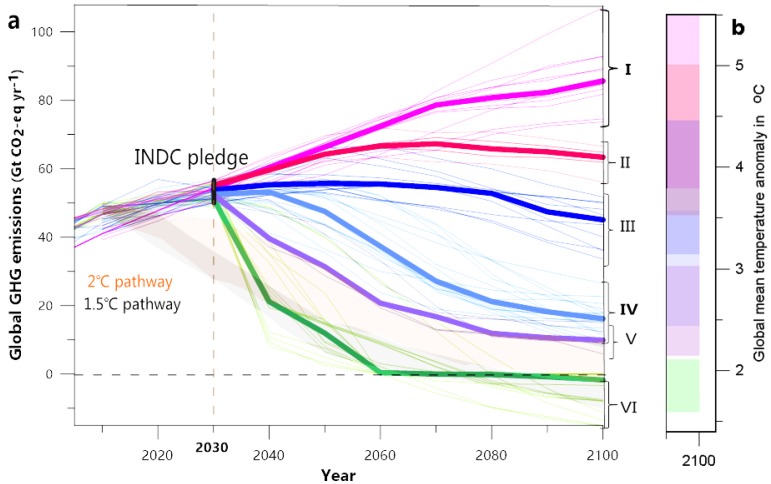
Global greenhouse gas emissions for INDC (Intended Nationally Determined Contributions) scenarios. (a) Future emission pathways analyzed in this study. Emission scenarios consistent with INDC pledges by 2030 are collected from the UNFCCC (United Nations Framework Convention on Climate Change) database. The INDC emission targets are calculated based on each country’s data and are estimated to be approximately 50–56 Gt CO2 for 2030. After 2030, various policy assumptions are grouped into six categories and different color lines display the extended emissions for the post-2030 period. Thick lines indicate the median emissions level for each group (I, II, III, IV, V, and VI). Group I (baseline scenario) contains scenarios without any additional climate policies or mitigation actions, where the greenhouse gas emissions continue to increase according to current trends. Group II is similar to the baseline scenario but allows for lower energy intensity in the future. Group III considers existing climate policies, a weak interpretation (e.g., 2020 Copenhagen Pledges), and extrapolation of these targets beyond 2020 based on emissions intensity. Global emissions were assumed to peak in 2030 in Groups IV to VI. Specifically, Group IV may be described as a “continued action” pathway. The relatively constant decarbonization rates were approximately followed for the period after 2030. The overall trend of Group V is similar to Group IV, but more rapid mitigation after 2030 is the distinguishing characteristic. Group VI involves CCS (Carbon Capture and Storage) action accelerating decarbonization and determining negative emissions in some pathways. The range of the 1.5 °C and 2 °C pathways are plotted for reference, in grey and orange shaded areas, respectively. (b) The estimates of global mean warming above the pre-industrial level (ΔT) for each scenario group (uncertainty range of 33–66% in color shaded areas).

