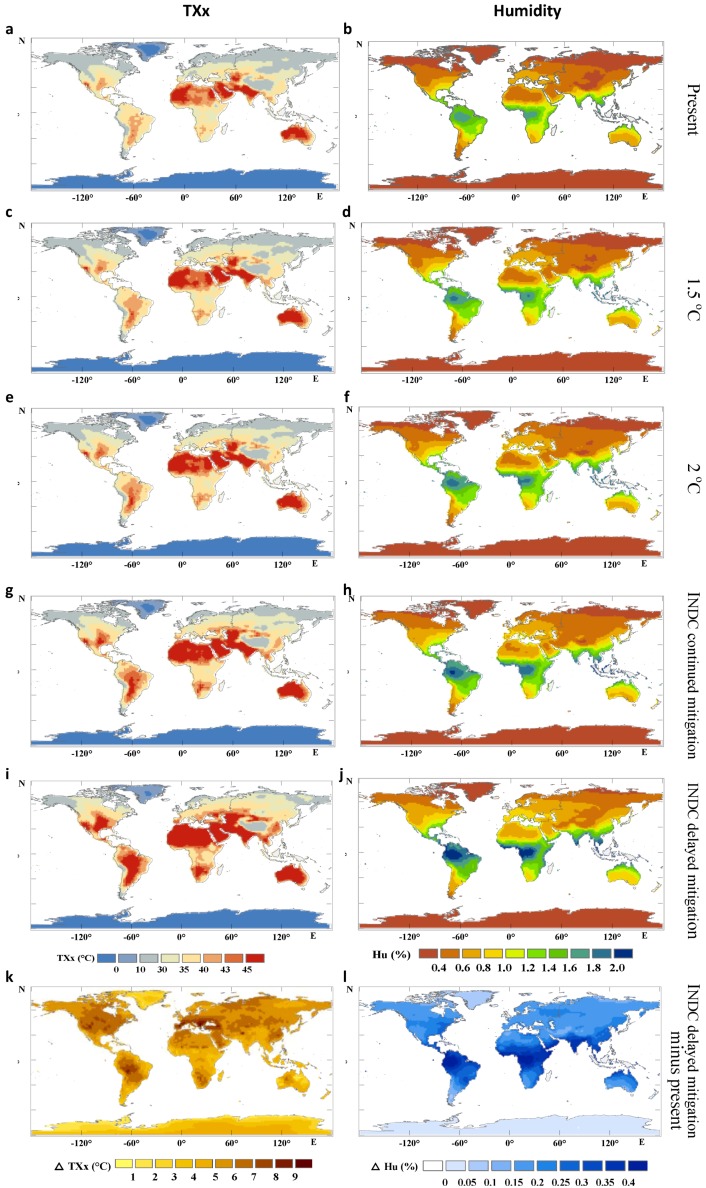
Figure 2.
Variation of the maximum atmospheric temperature (TXx, left column) and humidity (specific humidity, right column). (a,b): current level; (c,d): 1.5 °C scenario; (e,f): 2 °C scenario; (g,h): INDC continued mitigation scenario; (i,j): INDC delayed mitigation scenario; (k,l): INDC delayed mitigation scenario minus the current level.

