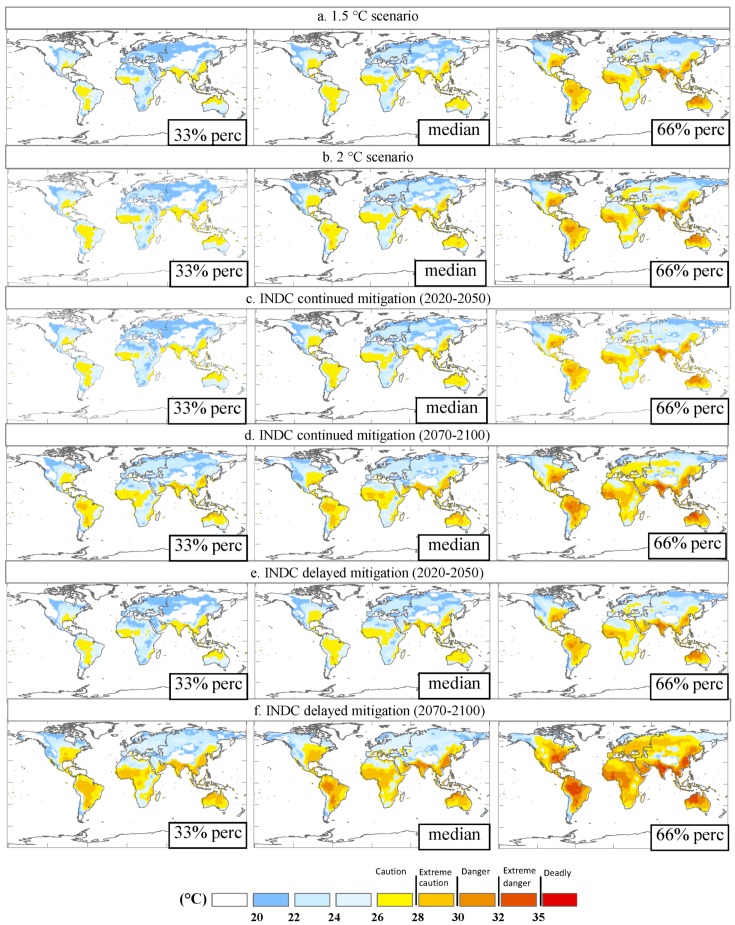
Figure 3.
Twmax of the hottest month under (a) 1.5 °C scenario, (b) 2 °C scenario, (c) INDC continued mitigation scenario in 2020–2050, (d) INDC continued mitigation scenario in 2070–2100, (e) INDC delayed mitigation scenario in 2020–2050 and (f) INDC delayed mitigation scenario in 2070–2100. The middle column presents the median of the values simulated by 14 CMIP5 (the fifth phase of the Coupled Model Intercomparison Project) GCMs (generalized circulation models) under four scenarios. The left column presents the 33% quantile of the values simulated by all models. The right column presents the 66% quantile of the values simulated by all models.

