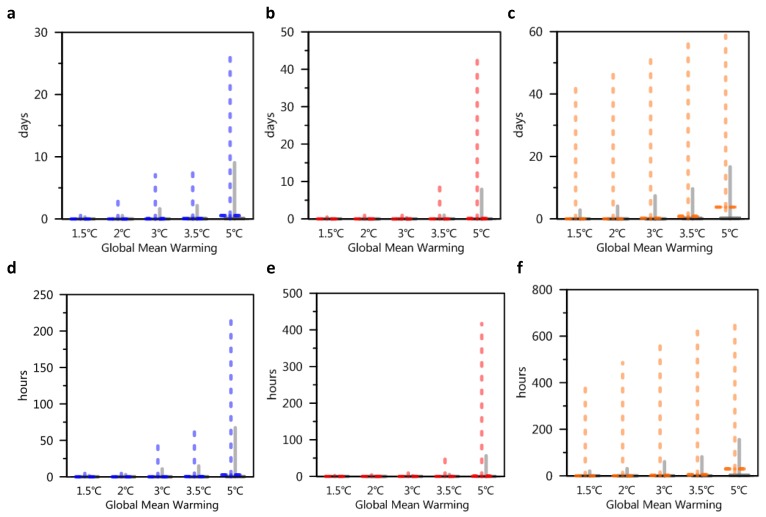
Figure 5.
Number of days and hours when the wet-bulb temperature exceeds 32 °C. (a) Days in China; (b) days in the Amazon; (c) days in South Asia; (d) hours in China; (e) hours in Amazon; (f) hours in South Asia. The colored dashed lines in each graph represent the maximum values of grid points predicted by multiple models, and the solid gray lines represent the average of all grids predicted by multiple models.

