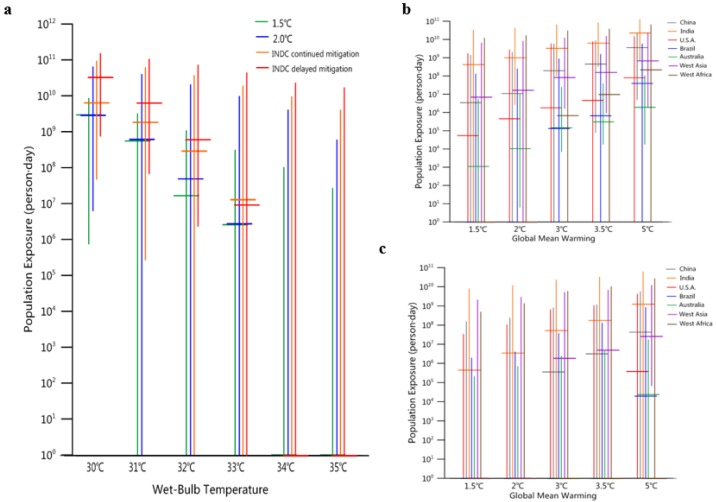
Figure 6.
Annual global person-days exposed to different wet-bulb temperature thresholds. (a) Annual global exposure under the four scenarios at wet-bulb temperatures of 30–35 °C. The error bars (vertical lines) present the range of 5–95% for 14 GCMs. The horizontal lines indicate the median values for 14 GCMs. Right: Annual exposure of regions with wet-bulb temperatures over (b) 30 °C and (c) 32 °C (32 °C is approximately the upper threshold of sustainable labor [33,34]). For the exposures at 34 °C and 35 °C of extreme high thresholds in (a), only a few models simulate the values, so the median values from 14 models are very small. Some models (such as IPSL-CM5A-LR) simulate the extremely lower value than other models results, which causes the low end of some error bars to be close to zero.

