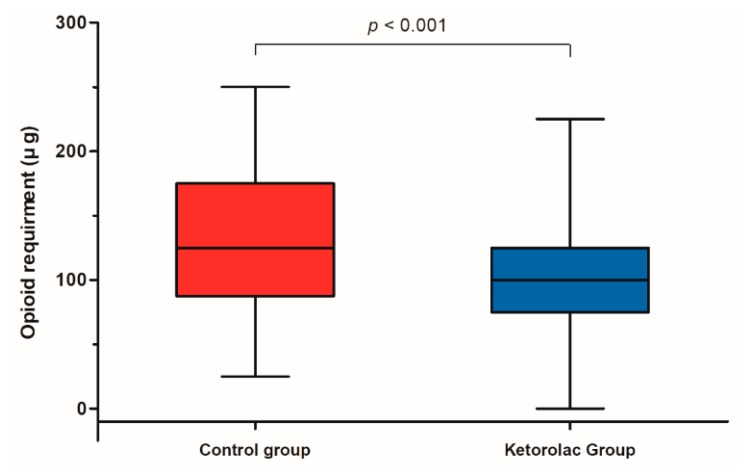
Figure 3.
Comparison of opioid requirements within 24 h after surgery between the control group (red box) and ketorolac group (blue box). The line inside the rectangle shows the median. The upper and lower ends of the box indicate the third quartile and first quartile, respectively. Whiskers above and below the box designate 90% and 10%, respectively.

