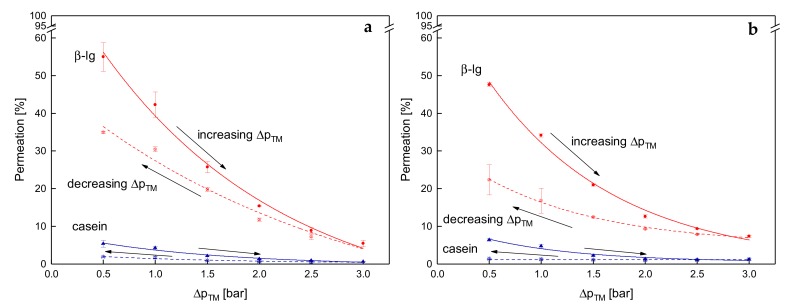
Figure 10.
Permeation of β-lg (circles) and casein (triangles) as a function of ΔpTM for one cycle of a stepwise increase of ΔpTM (filled symbols and solid lines) and the subsequent stepwise reduction of ΔpTM (blank symbols and dashed lines) at 10 °C (a) and 50 °C (b). Error bars represent the standard deviation of the permeation values of two individual experiments with milk from two different lots.

