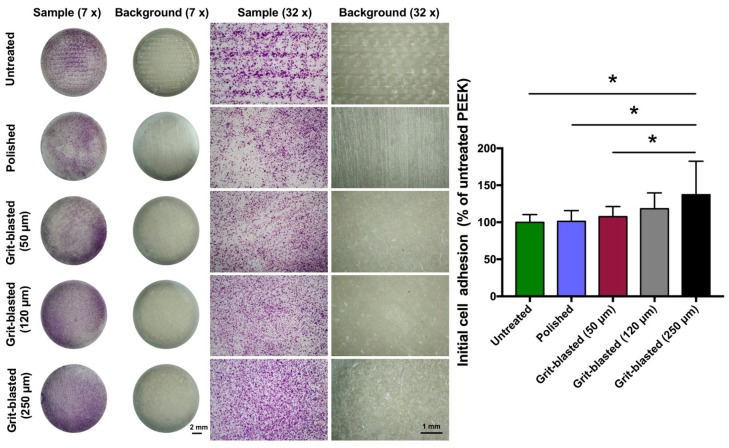
Figure 4.
Initial cell adhesion test of the FFF 3D printed PEEK samples in different groups. Representative images of crystal violet-stained osteoblasts on the sample surfaces after 4 h in culture. Left: overview, mag. 7×; right: detail, mag. 32×. The bar chart shows the relative absorbance of the different groups (normalized by the untreated FFF 3D printed PEEK). The data are presented as means ± standard deviations, * p < 0.05.

