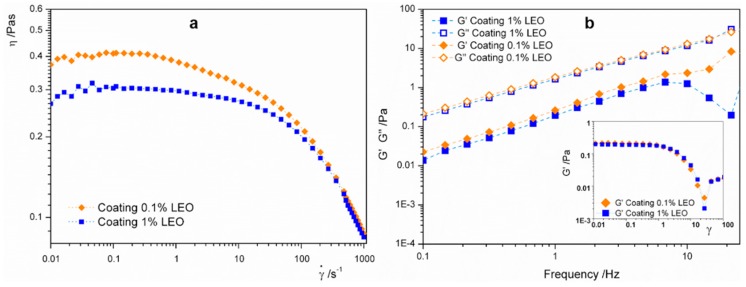
Figure 2.
(a) Apparent viscosity curves as function of the shear rate for alginate based nanoformulations containing 0.1% LEO or 1% LEO; (b) frequency sweep spectra of nanodispersions; storage moduli G’ represented with full symbols and loss moduli, G”, represented with empty symbols. Inset shows strain sweep of nanoformulations highlighting the linear viscoelasticity region. Nanoformulation containing 0.1% LEO is represented with orange diamonds, nanoformulation with 1% LEO is represented with blue squares.

