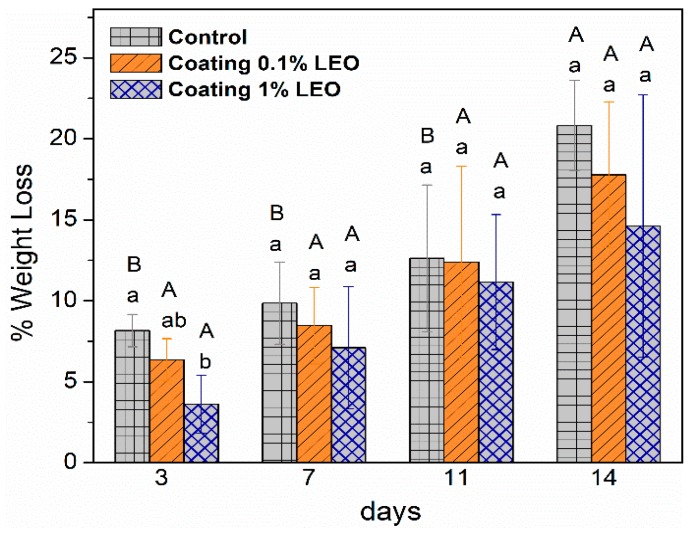
Figure 3.
Weight loss percentage of coated and uncoated (control) fresh-cut apples with different treatment during storage at 4 °C. Means with the same letters (lowercase: amongst different treatments for the same time; uppercase: for the same treatment during different storage times) are not significantly different according to Tukey’s test (p > 0.05). Vertical bars indicate standard deviation.

