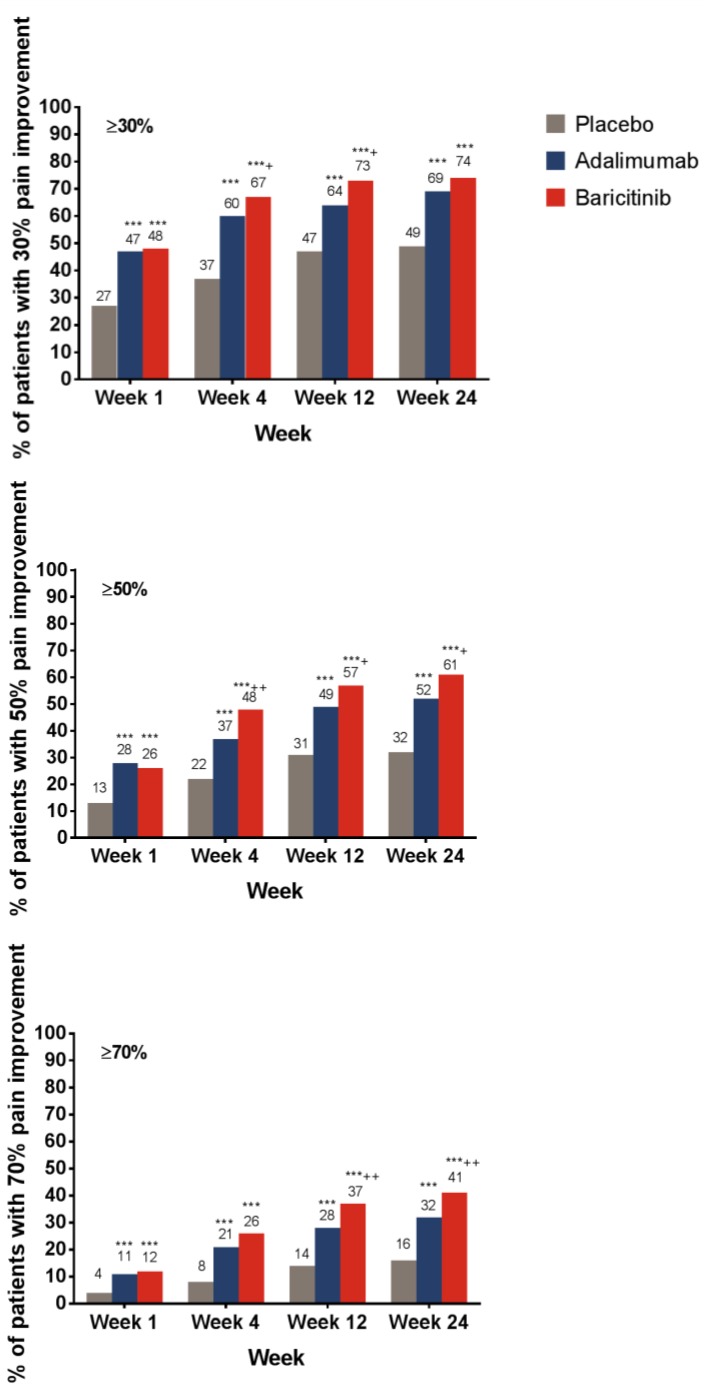
Figure 1.
Percentage of patients who achieved pain relief thresholds from baseline, as measured by the pain VAS. *** p ≤ 0.001 vs. placebo; † p ≤ 0.05; †† p ≤ 0.01, ††† p ≤ 0.001 vs. adalimumab. Abbreviations: VAS = visual analog scale. Number of respondents who answered the pain question by week: placebo, n = 481 at Week 1 and n = 483 at all other weeks; adalimumab, n = 325 at Week 1 and n = 327 at all other weeks; baricitinib, n = 482 at all weeks.

