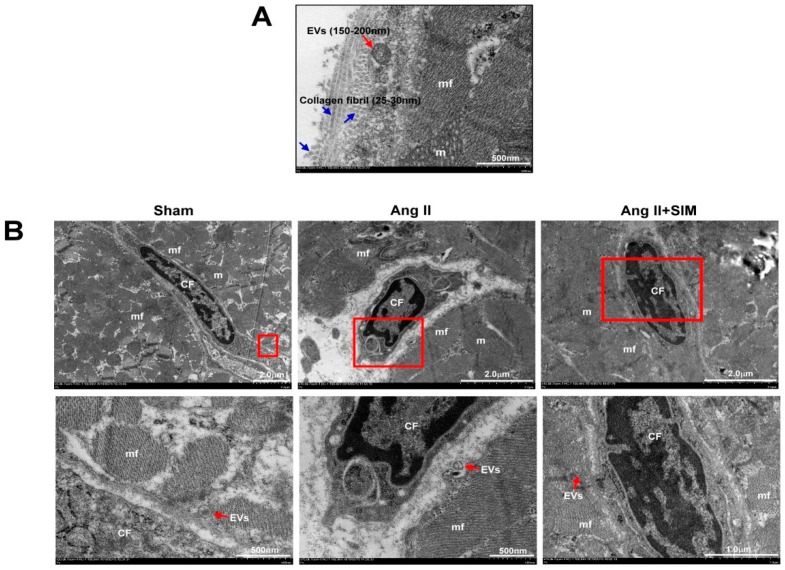
Figure 2.
Ultrastructure between CM and CF of the heart in vivo. The SD rats were divided into sham group, Ang II group and Ang II + SIM group (each group n = 6). TEM images of rat left ventricles demonstrated the morphology, size of longitudinal and cross-sectional collagen fibers, and extracellular vesicles (EVs) (A). The distribution of EVs between CM and CF was explored by TEM analysis (B) (mf, myofibril; m, mitochondrial; CF, cardiac fibroblast).

